Define surface plot
This dialog is used when you enter the New -> New Function Plot -> New 3D Surface Plot... command. It allows for the creation of a new function of two variables. When the "Function" Surface type is selected the coordinate system will be Cartesian and the function will be of the form: z = f(x,y).
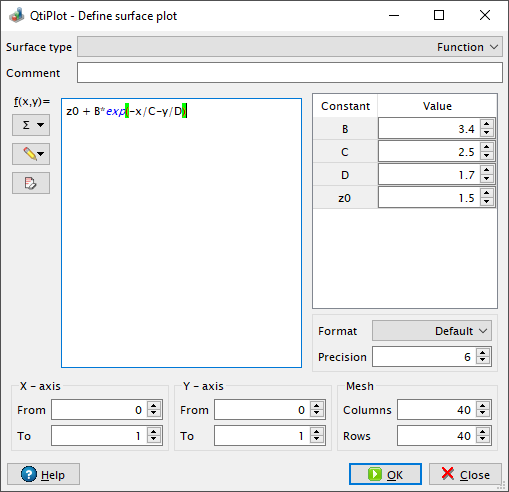
It is also possible to input a string in the Comment field of this dialog. If a non empty string is typed in this field, it will be displayed by the 3D legend objects instead of the mathematical formula(s) of the analytical/parametrical surface.
You may also define the limits of the X and Y scales and the mesh parameters, that is the number of Columns and Rows of the surface grid.
You can create parametric surfaces when the Surface type is set to
Parametric. The variable names used in this case are the latitude u and the
longitude v. If the function expression contains terms that are recognizable as constants, e.g.:
a*cos(u)*cos(v), QtiPlot detects them and displays a two column table on the right side of the dialog which contains
input spin boxes that simplify the process of setting appropriate values for the detected constants.
Here, for example, is how you might plot an ellipsoid with all three axes being easily adjustable:
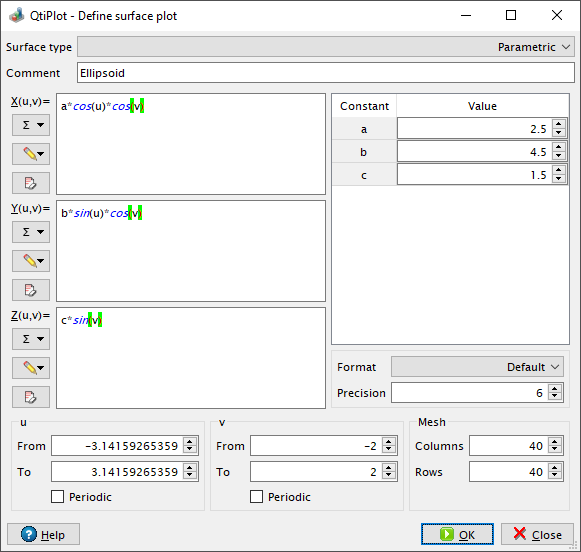
As in the case for functions, you can supply the drawing domain for the two angular parameters and you can define the mesh parameters. The more rows/columns you request, the better the resolution of the output image will be. However, this is at the cost of a larger memory consumption and an increased time of computation. A slow CPU and small amounts of memory will be limiting.
It is possible to provide information to the drawing routines about the rotational symmetry of the parametric surface using the two Periodic check box options (one for each parameter).
Finally, it is worth knowing that if you type a mathematical expresion containing the name
of the number pi or of any other physical constant, like the universal
gravitational constant (g), in the input range boxes for the parameters, the expression will be
automatically evaluated by QtiPlot and the result will be displayed in the input box.