QtiPlot - Data Analysis and Scientific Visualisation
Try for free
Home
Download
Buy
Pricing
Invoice
Payment
Contact
Support
Manual
FAQ
Tutorials
News
Latest
Archive
Subscribe
Latest News
Subscribe to new releases mailing list >>
2026/05/20 - QtiPlot 1.2.7 release available. New features and improvements:
Save projects, folders or individual windows to OPJU file format on Windows operating system, if OriginLab is installed on the same computer (even as a trial version).
Improved import of OPJU files from OriginLab: added support for importing font names, image windows and many more.
Added the possibility to append OPJU files to an existing project.
Added the File -> Open folder... command allowing to import all projects with the same file format from a user specified directory.
Implemented the possibility to save/load ASCII import settings to/from an XML file.
Improved drawing of 3D pie charts.
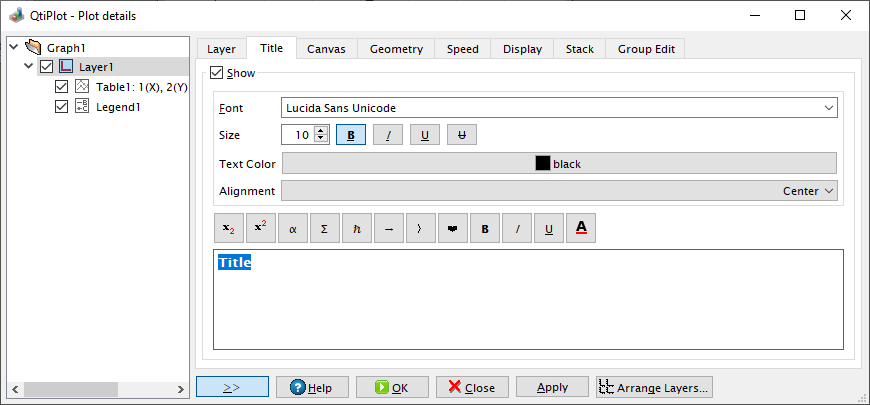
Added layer title tab to 2D plot details dialog.
Improved user interaction with table objects from 2D plot windows.
Added support for transparency to 2D color scale objects.
Implemented the possibility to revert the scale of 3D color legends.
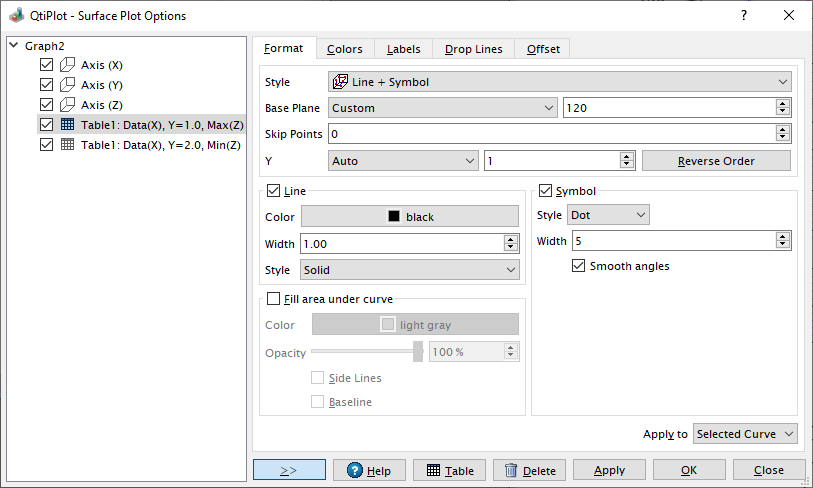
Added support for displaying drop lines for 3D scatter plots created from matrices.
Added the possibility to specify a default symbol size for 3D scatter plots.
Improved drawing of arrow heads for 3D vector curves.
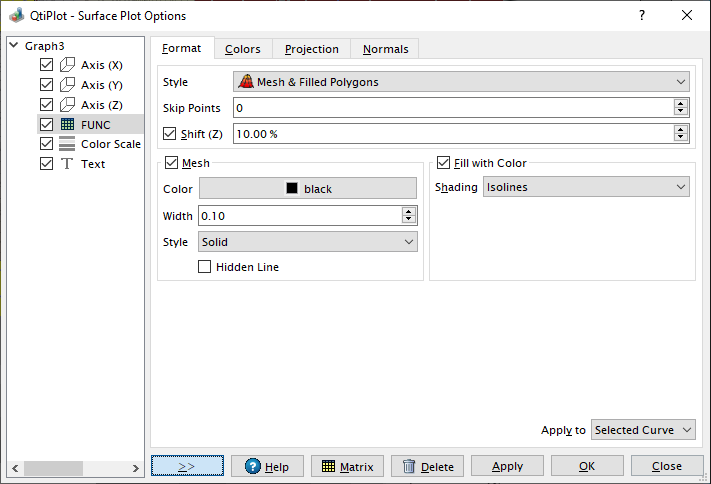
Implemented the possibility to draw wireframe 3D surface plots using a color map interpolated from Z data values.
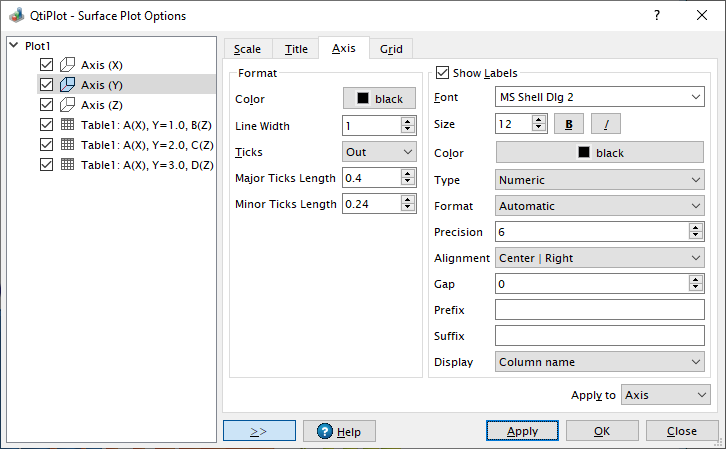
Improved handling of 3D axes ticks and added the option to divide tick labels by a custom factor.
Added the possibility to specify default tick lengths for the axes of 3D plots.
Added Sphere, Star and several 2D symbols for 3D scatter plots.
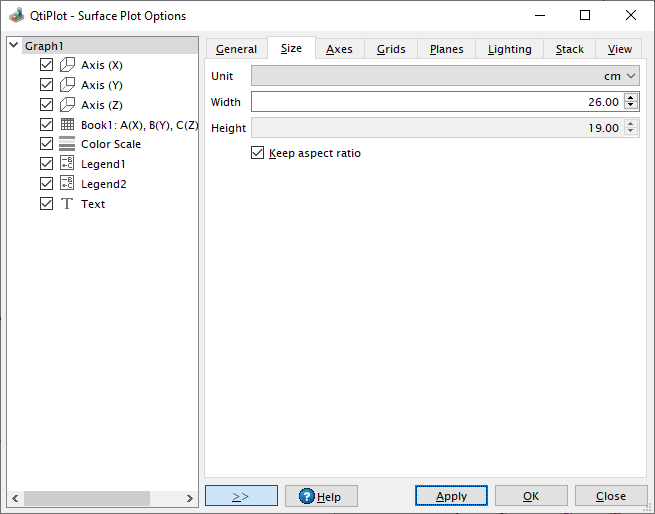
Added the possibility to define a font scaling factor for 3D plots and improved autoscaling of fonts when the size of the plot changes.
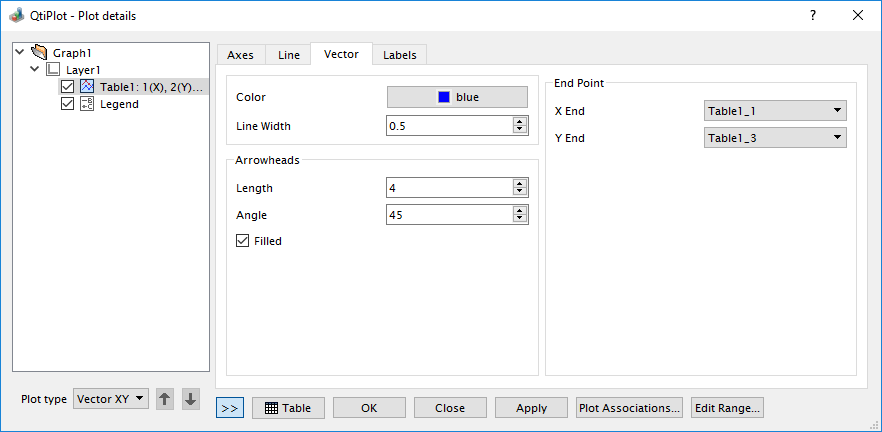
Improved 2D vector curves: added the possibility to set a custom line style and opacity.
Improved 2D box curves: mean and median lines are drawn even if only the data is displayed.
Added the possibility to customize the color representing missing data values in 2D matrix plots.
Improved graph preview of data channels in TDMS files.
Improved import of Excel .xlsx spreadsheets.
Bug fixes:
Fixed drawing of transparent planes in 3D plots.
Fixed drawing of 3D curves/surfaces if the speed mode is activated (Skip Points option is greater than zero).
Fixed lighting and title bar menu for 3D plots.
Fixed export of stacked 2D plot curves.
Fixed fitting with built-in Gauss2D and Voight2D models if the decimal point is set to be the the comma character.
Fixed setting data from matrices in 2D contour plots.
Fixed reference lines dialog.
Fixed overwrite file warning.
Fixed editing the data range of a 2D plot histogram.
Fixed export of 2D plot layers with invisible legends (outside the canvas area).
Fixed changing font of Unicode 2D plot symbols using the font toolbar.
Fixed display of 2D curve labels when source data column has empty cells.
Fixed parsing of the custom format string for 2D curve labels.
Fixed repeated error messages after setting column formula using muParser.