 |
QtiPlot - Data Analysis and Scientific Visualisation |
Try for free |
2025/08/17 - QtiPlot 1.2.6 release available. New features and improvements:
Bug fixes:
- Fixed spurious crashes when clearing table columns used in 2D plots.
- Fixed regression introduced in release 1.2.5 that affects setting the default frame type for 2D plot objects.
- Fixed default number of minor ticks not being honoured when drawing 2D plots with two or more vertical axes.
- Fixed language issues when resetting default options via the preferences dialog.
- Fixed cloning 2D histograms having a matrix window as data source.
- Fixed loading of 2D histograms from template files.
- Fixed drawing of error bars on horizontal 2D bar plots.
- Fixed exporting of 2D arrow heads to vectorial file formats.
- Fixed reversing stacking order for 2D plot curves.
- Fixed saving the user preferences for the dash pattern of 2D plot grids and legends.
- Fixed drawing of inward minor ticks in the case of inverted 2D plot scales.
- Fixed editing of 2D box curves via plot details dialog.
- Fixed parsing matching parentheses in 2D plot legends.
- Fixed rendering of transparent planes in 3D plot windows.
- Fixed mouse/keyboard moving of 3D text objects having a rotation angle.
- Fixed crash when creating 3D plots from text table columns.
- Fixed preview of tables and notes from the project explorer in dark mode.
- Fixed printing of tables and matrices and their export to PDF.
- Fixed export of note windows to PDF.
- Fixed baseline tool.
2025/01/26 - QtiPlot 1.2.5 release available. New features and improvements:
Bug fixes:
- Fixed parameters table disappearing from 2D plots after a fit operation performed using the fit wizard.
- Fixed positioning data labels for 2D plot layers with log Y axes.
- Fixed import from ASCII files of data values containing + sign followed by space characters (e.g. '+ 1.23').
- Fixed import of ASCII files having comma characters in their name.
- Fixed filling area under 2D plot curves with decreasing abscissas.
- Fixed drawing of 2D axis backbones in case of large line widths.
- Fixed exporting the frame of 2D plot layers.
- Fixed hidden dialog not becoming visible after click on its title in the "Windows | Dialogs" menu list.
- Fixed changing the visibility of violin plots.
- Fixed adding of ridgeline curves to an exiting 2D plot.
- Fixed multipeak fit tool: line dialog became visible after a double-click on a line object during peak selection.
- Fixed size of 2D plot windows imported from Open Document Spreadsheet files (.ods).
- Fixed import of Excel .xls files using LibreOffice.
2024/10/10 - QtiPlot 1.2.4 release available. New features and improvements:
- Added the possibility to hide/show the title of color scales in 2D and 3D plots.
- Improved mouse interaction with color scales.
- Added the possibility to hide/show the title of an axis in a 2D plot layer.
- Added a context menu for the title of a 2D color scale axis.
- Improved import of 2D plot windows from OriginLab files.
- Improved export to Origin .c files: all color scales in a 2D plot layer are now exported.
- Improved Python API.
Bug fixes:
- Fixed mouse interaction with table header: spurious column move operations were generated, leading to increased CPU usage and eventually blocking the application.
- Fixed crash in 2D fit wizard when trying to display the fit preview for an empty user defined fit model.
- Fixed import of hidden text objects from 2D plot windows in OriginLab *.opj files.
- Fixed import of hidden axes titles from 3D plot windows in OriginLab *.opj files.
2024/08/23 - QtiPlot 1.2.3 release available. New features and improvements:
Bug fixes:
- Fixed crash when trying to paste a project window that has been already closed.
- Fixed 2D plot titles not being always aligned with the left side of the graph.
- Fixed import of *.tdms files from National Instruments.
- Fixed import of some *.org files from OriginLab.
2024/06/05 - QtiPlot 1.2.2 release available. New features and improvements:
Bug fixes:
- Fixed possible crash when removing a curve from a 2D plot layer that also contains contour plots.
- Fixed crash when changing the axes to which a 2D contour plot is attached.
- Fixed drawing of error bars in 2D plot layers with stacked curves.
- Fixed crash in FitWizard 2D after fitting data sets with different sizes.
- Fixed direct weighting with negative values in multiple linear regression.
- Avoid crash on Windows when trying to open .opj files having names containing non-ASCII characters.
2024/04/07 - QtiPlot 1.2.1 release available. Bug fixes:
- Fixes regression in import ASCII files dialog.
- Fixed dark mode for the fit wizard: black text color was wrongly used to display parameter names.
- Fixed invisible 2D plot title in dark mode.
- Fixed legend sometimes not being displayed entirely for new 2D plots.
2024/04/05 - QtiPlot 1.2.0 release available. New features and improvements:
Bug fixes:
- Fixed smooth curve dialog: only one smoothed curve is created per session.
- Fixed regression in previous release affecting the fit wizard: the preview curves were not correctly dettached from the 2D plot.
- Fixed mouse selection of 2D plot curves.
- Fixed embedded reference line dialog being hidden when opening the edit dialog of the associated legend.
- Fixed possible crash in regular grid XYZ dialog if the hidden matrix window it creates is deleted by the user.
- Fixed crash after deleting a 2D plot curve and immediately presing a keyboard key.
- Fixed matrices with empy cells being completely emptied after bicubic interpolation.
- Fixed possible crash when increasing the size of a matrix via the Set Matrix Values dialog.
- Fixed setting the weights for fit operations performed on 2D plot curves with a limited data range.
- Fixed initial ROI detection in Intersections tool.
- Fixed creating new matrix from an analytical user surface.
- Fixed error messages for readonly columns being displayed many times when recalculating depending columns.
2024/01/04 - QtiPlot 1.1.9 release available. New features and improvements:
Bug fixes:
- Fixed 2D hysteresis line curves not being drawn correctly after a zoom or scale change operation.
- Fixed screen turning black on Windows after exporting 3D plot animations to *.avi files.
- Fixed saving of 2D plot objects with zero line width.
- Fixed number of major ticks changing each time the Apply button is pressed in the Scale tab of the General plot options dialog.
- Fixed Minimize button in dialogs not being available on macOS.
- Fixed crash when loading project files containing 3D scatter plots.
- Fixed handling of color scaling in 3D plots created from matrices.
- Fixed crash in the Random XYZ gridding dialog if the preview box is not checked when pressing the OK button.
- Fixed display of the column name for the weighting dataset in the fit wizard when editing existing fit operations.
- Fixed crash when loading project files containing fit operations from sorted data sets.
- Fixed fit residuals and statistic tables being created after fit operations even if not asked by the user settings.
- Fixed editing matrix color palette on macOS.
- Fixed crash when deleting all rows of a table used as data source in 2D plots.
- Fixed handling of very small values when using scientific notation in spin box controls.
- Fixed bilinear interpolation algorithm used for resampling matrices.
- Fixed slow import of large ASCII files to matrices.
2023/10/21 - QtiPlot 1.1.8 release available. New features and improvements:
Bug fixes:
- Fixed application being hidden after appending project files containing 3D plot windows.
- Fixed drawing of 2D column/bar curves with only one data point.
- Fixed displaying only integer values of the line width for 2D plot curves.
- Fixed handling of mouse wheel in 2D and 3D plot windows.
- Zoom and Drag Canvas tools in 2D plots also work with Apple mouse.
- Fixed new 3D plot legends not being created inside the plot window.
- Fixed deletion of 3D plot legends.
- Fixed weird value being displayed sometimes in double input boxes instead of zero.
- Fixed crashes when closing a project or when starting a new one on Linux and Windows operating systems.
- Fixed display of error bars attached to horizontal bar curves.
- Fixed adding error bars for data curves containing zero values in 2D plots with logarithmic scales.
- Fixed export of matrices to .ods files.
2023/09/13 - QtiPlot 1.1.7 release available. Bug fixes:
- Fixed wrong display of the line width for 2D plot curves on macOS computers with high resolution screens, due to the use of cosmetic pens.
- Fixed loading of error bar curves from projects created on systems with different DPI settings.
- Fixed regression affecting the baseline tool.
- Fixed sporadic crashes when using the translate curve tool on macOS.
- The application no longer exits when trying to import an OriginLab .OPJU file on macOS or Linux operating systems.
- Corrected the explanation string displayed for the log function when using muParser as script engine.
2023/08/31 - QtiPlot 1.1.6 release available. New features and improvements:
Bug fixes:
- Menus and tool bars are updated with respect to the type of active window when importing OriginLab files.
- Data is no longer sorted before performing a smooth operation on a 2D plot curve.
- Fixed restoring the line width of 2D plot axes from project files.
- Fixed import ASCII dialog freezing on Ubuntu when trying to open the file or path selection dialogs.
- Fixed drawing of the frame and shadow of 2D plot objects.
- Fixed 3D vectors plot: the trajectory is no longer displayed.
- Fixed display of very small values by the data reader tools for 2D plots.
- Fixed application being hidden after opening 2D plot template files with very specific size constraints.
2023/06/09 - QtiPlot 1.1.5 release available. New features and improvements:
- Added the possibility to customize the name of 2D plot objects.
- Improved 2D plot details dialog: display the comment of an analytical function, if not empty, instead of the default function name (F1, F2, etc...).
- Improved support for dark mode.
- Improved import of charts from *.ods files.
- Legends and text boxes in 2D plots are now updated without the need to click the Apply button.
- Automatically detect data interval when adding an analytical function to an existing 2D plot.
- Improved Python API: added support for accessing 2D plot objects by name.
- Implemented the possibility to cancel an undergoing translation operation on a 2D plot curve.
- Improved export to Origin C files.
- Improved import of Origin *.opj project files.
Bug fixes:
- Fixed display of error messages when entering negative values or floating point numbers in scientific notation.
- Fixed transparency of the background color for texts and legends in 2D plots on Linux and Windows operating systems.
- Fixed drawing of tick marks in the case of 2D plot axes with break.
- Fixed maximized 2D plot windows being shown as normal after a click on a data point.
- Axes are no longer automatically scaled after translation operations on 2D plot curves.
- Fixed unwanted autoscaling in 2D plots when using select data range tool.
- Fixed export of 2D functions to Origin C files.
2023/05/26 - QtiPlot 1.1.4 release available. New features and improvements:
Bug fixes:
- Fixed display of very small tolerance values for the DouglasPeucker algorithm in layer speed page dialog and refreshing of 2D plots after changes in tolerange values.
- Fixed scrambling of 2D plot legend items after reordering the plot curves.
- Fixed 2D axes being unintentionally moved after a doubleclick if the left mouse button remains pressed and the user moves the cursor through the axes dialog, for example.
- Fixed moving of 2D plot layers using the arrow keys.
- Fixed moving of central 2D plot axes using the mouse or the arrow keys.
- Fixed editing of central 2D plot axes.
- Fixed crash when opening the properties editor of a 2D color map plot.
- Fixed behavior of input double spin boxes: restored keyboard tracking.
- Fixed drawing the border of 2D color scales.
- Fixed project windows not being correctly activated.
- Fixed crash when appending .opj projects with 3D plot windows.
- Fixed crash when trying to plot a contour/color map plot from a Z table column having all values equal.
2023/02/24 - QtiPlot 1.1.3 release available. New features and improvements:
Improvements to the equation editor:
Bug fixes:
- Fixed applying 2D axis thickness to the whole layer in general plot options dialog.
- Fixed export of 2D plots when using multiple screens with different DPI settings on Windows operating system.
- Fixed crash when editing an interpolation filter.
- Fixed display of the results of PseudoVoight2 fit operations.
- Fixed crashes when loading projects containing pie charts on Linux operating system.
- Fixed import of data sets from OriginLab *.ogg files.
2022/11/26 - QtiPlot 1.1.2 release available. New features and improvements:
Bug fixes:
- Fixed saving/loading of fit operations.
- Fixed exporting of 2D plot tables.
- Fixed crashes occurring occasionally when closing tables or when clearing table columns.
- Fixed context menu of 2D plot windows not being shown after a right-click.
2022/10/21 - QtiPlot 1.1.1 patch release available. New features and improvements:
- Simplified 2D curves tab of the preferences dialog by moving some of the controls to a
new symbol tab.
- Simplified 2D grid tab from the preferences dialog.
- Improved support for the Kvantum style theme on Linux.
Bug fixes:
2022/10/07 - QtiPlot 1.1 release available. New features and improvements:
Bug fixes:
- Emptying a table column also removes depending plot curves.
- Fixed error messages wrongly closing the window properties dialog.
- Fixed export of 2D matrix color fill plots to Origin .c files.
- Fixed setting the format for spectrogram labels to engineering and upper exponential formats.
- Fixed checks for empty expressions in function dialog.
- Fixed application hanging up when using the project explorer and fixed drawing the window preview.
- Fixed 2D bar curves having zero width in some very particular cases.
- Fixed behaviour of the rename window dialog.
- Fixed handling of the covariance matrix window of a data fit operation.
- Fixed updating analysis filters based on single data columns.
- Fixed export of 2D plot layers to raster image formats.
- Fixed export ASCII dialog: column units setting was ignored when exporting all tables.
2022/06/15 - QtiPlot release 1.0.0 available. New features and improvements:
Bug fixes:
- Fixed regression affecting the size of the icons on high DPI screens.
- Fixed wrong pixels to points conversion in 2D plot layer canvas size dialog.
- Fixed text color of 2D layer index buttons in dark mode on macOS.
- Fixed import of NI TDMS files saved with an invalid array dimension.
- Fixed saving/restoring the geometry of the Python script window.
- Fixed editing of 2D plot special tick labels on Linux and Windows.
- Fixed crash when trying to plot a Pareto chart from an empty table column.
- Fixed drawing the labels of box curves.
- Fixed regression on macOS: a double-click on a .qti project name now opens the file in a new window.
- Fixed restoring empty titles of 2D plot top/right axes.
- Fixed scrolling in large projects when built with Qt5.
- Fixed closing projects having Python scripts running periodically.
- Fixed application window turning all black after undo/redo operations on 3D plots on Windows.
- Fixed crash when opening the Fit Wizard from the multipeak fit tool on Linux and Windows systems.
- Fixed drawing of 2D arrows that extend outside the layer canvas.
- Fixed setting the style of the grids in 3D plot windows via the preferences dialog.
- Fixed setting the number of output points in the linear and polynmial fit dialogs.
- Fixed export of date/time columns to Origin .c files.
2022/02/15 - QtiPlot 1.0.0-rc17 release available. New features and improvements:
Bug fixes:
2022/01/24 - QtiPlot 1.0.0-rc16 release available. New features and improvements:
Bug fixes:
- Fixed opening of a .qti file via Finder on macOS: the extra new project window is automatically closed.
- Fixed crash when loading some .qti project files with nonlinear data fit filters.
- Fixed 2D curve linewidth issues when exporting to vectorial formats.
- Fixed custom color map dialog on macOS when it is used to edit color edges/filling for 2D plot symbols.
- Fixed file browsing button from the image tab of the image options dialog.
- Fixed size of overlapping plot layers created by using MultiCurve | 3Y: YYY or 4Y: YYYY menu actions.
- Fixed bug in plot associations dialog affecting curves with attached error bars.
- The window frame of the preview table is no longer displayed in the import ASCII dialog.
- Fixed editing of a 2D axis title having superscripts/subscripts in the General Plot Options dialog.
- Fixed freezing when changing the limits of a 2D axis scale for plot layers with lines/arrows.
- Fixed possible crashes when closing 2D plot windows with selected curves.
- Fixed copy/pasting single table columns with different number of rows.
- Fixed opening of some old project files.
- Fixed saving of the number of minor ticks for 2D axes with inverted scales.
- Fixed duplication of 2D plots with stacked curves.
- Fixed handling of data offsets for 2D plot curves.
- Fixed export to Origin C files for 2D plot having hidden legends.
- Fixed drawing of bin data points in the case of box curves using unicode or image symbols.
- Fixed creation of 3D plots/contour plots from XYZ data columns.
- Fixed printing of 2D plot windows.
- Fixed freezing when opening OriginLab files having tables with very large number of columns.
2021/09/02 - QtiPlot 1.0.0-rc15 release available. New features and improvements:
Bug fixes:
- Fixed hidding of 2D axis ticks placed at the begin or end of the scale division.
- Fixed exporting of 2D plots to PDF.
- Fixed the length of the exported curve line symbol from 2D plot legends.
- Fixed Table > Convert to Matrix > Random XYZ dialog turning completely black on Windows.
2021/06/04 - After almost one year of hard work, we are proud to announce release 1.0.0-rc14 of QtiPlot, which greatly improves 3D graphing:
- Starting with this release QtiPlot can display multiple 3D surfaces in the same plot window.
- Implemented new 3D plot types: inline 3D bars, stacked 3D area,
stacked 3D bars, percent stacked 3D area,
percent stacked 3D bars, 3D waterfall and
3D color mapped waterfall.
- Added the possibility to fill the sides of the 3D coordinate system with a custom color.
- Implemented lighting for 3D plot surfaces.
- Added the option of showing surface normals for 3D plots.
- Added the possibility to customize the number of isolines for the floor projection of 3D surfaces.
- Added the possibility to choose the base plane, between zero and minimum Z value, for 3D bars.
- Added the possibility to customize the projection plane for 3D surfaces.
- Implemented asymmetric (non square) 3D bars.
- Added the possibility to customize the grid lines for each axis in a 3D plot.
- Added the possibility to define the position, rotation angle, frame and background of the 3D plot title.
- Users can add multiple text objects to a 3D plot window.
- Implemented mouse and keyboard interaction with color legends and text objects in 3D plots.
- The parameters of 3D plot animations can be customised.
- Selected 3D texts and legends can be moved with the arrow keys in order to fine tune their position.
- Pressing Enter/Return key with a selected 3D text/legend opens the properties dialog.
- Text fonts and colors for 3D plot objects can be customized via the format tool bar.
- It is possible to customize the visible axes in 3D plots.
- Added the option to set a custom step value for the scales of a 3D plot.
- Added new 3D box symbol style.
- Added two predefined coordinate system styles: left halfbox and right halfbox.
- Added the possibility to display symbol labels for 3D curves created from tables.
- Added the possibility to create a new empty 3D plot.
- Implemented the possibility to define a comment for 3D user functions.
- Reorganised user preferences dialog for 3D plots using multiple tabs.
- Added the possibility to export 3D texts as paths when exporting to vectorial image formats (EPS, PDF, SVG).
- Implemented in place editing for 3D plot texts.
- Improved Python API for 3D plots.
Several improvements were also made to 2D graphing:
- Improved Plot Wizard: the user can duplicate and edit manually existing plot curves.
- The size of the plot details dialog is remembered during a work session.
- Added undo/redo support for apply template operations performed on 2D plot windows.
- Improved handling of Unicode symbols for 2D plot curves: the code of the symbol can be typed by the user.
- Implemented the possibility to display text strings as 2D curve symbols.
Improvements were also made to the functioning of table windows:
- Table columns can now be moved by drag and drop.
- Added submenu 'Move column' to the context menu of a table column.
- Added support for the hyperbolic secant and cosecant functions: sech(x) and csch(x).
Python support as well as the Fit Wizard were also enhanced:
Bug fixes:
- Fixed 2D plotting from templates.
- Fixed drawing of 2D plot axes backbone.
- Fixed setting a rotation angle for 2D axes with special tick labels.
- Fixed drawing of 2D color scales.
- Fixed column selection via keyboard shortcuts in table column dialog.
- Fixed adjusting table column width to its content when long names, units, comments or formulas are displayed in the header.
- Fixed 2D plot windows being unresponsive after applying a plot template.
- Fixed crash when deleting a 2D plot layer via the context menu of the plot details dialog.
- Fixed saving of projects with LOWESS smooth data filters.
- Fixed crash when editing LOWESS smooth data filters.
- Fixed baseline subtraction tool.
- Fixed export of the line width for various 2D plot objects to SVG.
- Fixed export of 2D plot legends, rectangles and ellipses to Origin C files.
- Fixed full screen view mode for 3D plots.
- Fixed angle information for a 2D line object.
- Fixed behaviour of 2D plot scales from text columns: empty cells are also taken into account.
- Fixed scientific notation for 2D plot scales when comma is the decimal separator.
- Fixed zoom and drag canvas tools for 2D plots on macOS.
- Fixed bug leading to empty heat map plots in some rare cases.
- Fixed saving of user custom actions with file names containing special characters, like ampersand.
- Fixed handling of 2D curve labels via the plot dialog.
- Fixed possible crash when drawing a 2D plot arrow having end point(s) in an axis break region.
- Fixed loading of projects created on systems with different DPI settings.
- Fixed point to pixel unit conversion.
- Fixed crash on macOS when deleting selected 2D plot layers via the context menu.
- Fixed wrong 2D curve deletion when changing the plot range.
- Fixed possible crash when entering table cell values with a wrong decimal point format.
- Fixed plotting of stacked bars/columns from template files.
- Fixed bug affecting adding single data columns to 2D plots via the Add/Remove curves dialog.
2020/06/11 - QtiPlot 1.0.0-rc13 release available. New features and improvements:
Bug fixes:
- Fixed possible crash in Fit Wizard when guessing initial values for Logistic, Sigmoidal or GaussAmp fit models.
- Fixed possible crash in Fit Wizard when deleting fit curves after an unsuccessful fit operation.
- Fixed wrong initialisation of fit parameters in Fit Wizard in very rare cases.
- Fixed on screen drawing of inward ticks in 2D plot axes.
- Fixed drawing of inward ticks for 2D plot axes.
- Fixed crash when loading 2D plot axis from projects in very rare cases.
- Fixed unresponsive 2D plot windows after loading a project file on Windows and Linux operating systems.
- Fixed loading of EMF files on macOS and Linux operating systems.
- Fixed handling of full screen windows on macOS.
- Fixed handling of 2D plot labels.
- Fixed unclipped export of 2D curve labels to SVG and PDF.
- Fixed export of 2D plots containing filled patterns to SVG.
- Fixed drawing of box charts.
2020/04/30 - QtiPlot 1.0.0-rc12 release available. New features and improvements:
Bug fixes:
- Fixed loading of pie chart labels.
- Fixed crash that may occur in very particular cases when deleting last column in a table.
- Fixed reloading of vector curves when source data columns change.
- Fixed saving/restoring of color scale widgets.
- Fixed handling of nonzero baseline values for column/bar plots.
- Fixed initialisation of axes titles when drawing 2D bar plots.
- Fixed wrong loading of disabled grids in 3D plots.
- Fixed handling of line smoothness for 3D plot curves.
- Fixed loading of 3D plot templates.
- Fixed the list of depending graphs for matrix windows in the project explorer.
- Fixed export of non solid grid lines from 3D plots to vectorial image formats.
- Fixed multiple selection in the project explorer.
- Fixed bug in Plot Associations dialog that lead to removal of a curve if the column names contained the dot character.
- Fixed crash on macOS when loading projects created with release 0.9.9.8 that contain 3D plots.
- Fixed system error messages when building with Python 3.
- Fixed empty Correlation/Autocorrelation plot from fully selected table columns.
- Fixed wrong modification of the number of minor ticks after adding new curves to a 2D plot.
- Fixed bug in 2D function dialog causing generation of invalid constant parameters.
- Fixed weights initialisation in fit operations affecting auto recalculation.
- Fixed crashes on Windows when loading TIFF images with 32bit samples.
- Fixed opening of project files raising QXmlStreamReader errors when built with Qt5.
- Fixed adding special characters in the 3D plot dialog on macOS.
2019/11/27 - QtiPlot 1.0.0-rc11 release available. New features and improvements:
Bug fixes:
- Fixed manual editing of time column cells.
- Fixed export of projects to Origin .c files.
- Fixed bug causing hidden windows to be unresponsive after being made visible.
- Fixed possible crashes when trying to access the Functions menu from script editor windows if built with Python 3.
- Fixed duplicating of notes windows with multiple tabs.
- Fixed parsing of escape sequences in 2D plot legends.
- Fixed display of the axis title in the General Plot Options dialog when switching from bottom axis to the left axis.
- Fixed wrong deletion of all column cells even if only the first cell is selected.
- Fixed bug in date scale engine preventing minor ticks to be drawn in some cases.
- Fixed possible deletion of existing files in export dialog.
2019/09/18 - QtiPlot 1.0.0-rc10 release available. New features and improvements:
Bug fixes:
- Fixed displaying of the window preview for minimised 2D plot windows.
- Fixed possible crash when deleting table rows via Python scripts.
- Zoom plots are correctly updated after addition/removal of plot curves to/from linked source layer.
- Fixed handling of first and second text row in import ASCII dialog.
- Fixed unresponsive keyboard shortcuts from the File menu.
- Fixed crashes when changing curve style for empty 3D plots.
- Fixed installation of the user manual files.
- Fixed opacity handling for 2D bar curves with incremental color policy.
- Improved filling of the area bellow curves with data range gaps.
- Fixed wrong scaling of fonts in 3D plots after restoring minimized windows.
- Fixed possible crash in Fit Wizard.
- Fixed overlapping options in the plot export dialog for PNG format on Windows.
- Python API: removed obsolete fit.resultFormula() method that was always returning an empty string.
2019/06/27 - QtiPlot 1.0.0-rc9 release available. New features and improvements:
Bug fixes:
- Fixed handling of font weights when exporting 2D plots to .emf files on Linux/macOS platforms.
- Fixed error messages displayed when double-clicking a column header in the ASCII import dialog.
2019/05/08 - QtiPlot 1.0.0-rc8 release available. New features and improvements:
- Added support for Python 3.
- Display build Python version in the Help | About QtiPlot dialog.
- Report FWHM in the results log after data fit operations using Gauss and GaussAmp profiles.
- Implemented error bars with filled area.
- The General Plot Options dialog raises an error message for input step values resulting in a number of major ticks larger than the maximum limit specified in the General tab.
- Added pseudo Voigt peak profiles to the list of built-in functions.
- Improved speed when drawing 2D plot curves with B-Spline style.
- Improved speed when exchanging XY axes of a 2D plot layer.
- Improved 2D cubic interpolation method and reduced the minimum number of input points to 2.
- The Python function Interpolation.evalAt() also returns valid values in the case of Akima splines.
- Better Unicode support when importing Microsoft Access files (.mdb, .accdb) on macOS/Linux systems.
- Added support for importing .accdb files created with Microsoft Access ( <= 2010) on macOS/Linux systems.
Bug fixes:
- Fixed spurious drawing of curve symbols that are out of canvas range for 2D plots with exchanged X/Y axes.
- Fixed possible crash when setting Bezier style for 2D plot curves.
- Fixed possible divisions by zero when setting B-Spline style for 2D plot curves.
- Fixed synchronization of opposite 2D plot scales.
- Fixed displaying of syntax errors in column and matrix values dialogs.
- Fixed handling of double-click in 2D plots on Windows systems.
2019/03/18 - QtiPlot 1.0.0-rc7 release available. New features and improvements:
Bug fixes:
- Fixed output of two-way ANOVA when interactions between factors are disabled.
- Fixed regression introduced in release 1.0-rc5 disabling column preview images.
- Fixed bug affecting editing of data/time table cells in some very rare use cases.
- Fixed wrong names of FactorA/FactorB levels reported in the results log for two-way ANOVA.
- Fixed restoring of the line width for 2D plot curves from project files.
- Fixed crash in correlation/autocorrelation analysis for table columns having a number of rows that is not a power of 2.
- Fixed bounding rectangle of 2D bar curves.
- Fixed possible crash when importing TDMS files.
2019/01/09 - QtiPlot 1.0.0-rc6 release available. This is a bug fixing release:
-
Fixed regression introduced in release 1.0-rc5 affecting restoring of 2D plot legends and other objects from project files.
2019/01/03 - QtiPlot 1.0.0-rc5 release available. New features and improvements:
Bug fixes:
- Fixed display problems in image profile tool.
- Fixed updating of 2D plot curves after editing table cells.
2018/11/08 - QtiPlot 1.0.0-rc4 release available. New features and improvements:
Bug fixes:
- Fixed possible crash when calling undo/redo for tables after cell edit operations.
- Fixed possible crashes after a fit operation with residuals curve enabled.
- Fixed possible crashes in Average Multiple Curves, Baseline and Interpolation dialogs if the curve data sizes are less than the minimum size requested by the selected interpolation method.
- Fixed recalculation for data fit operations with Instrumental weighting after modification of the error bar values.
- Fixed transparency issues when exporting to PDF.
2018/10/17 - QtiPlot 1.0.0-rc3 release available. New features and improvements:
Bug fixes:
- Fixed crash when restoring 2D plot windows from project files.
- Fixed wrong results in fit operations with instrumental weighting errors performed via the Analysis menu: Fit Slope, Fit Linear and Fit Polynomial.
- Fixed calculation of adjusted R square in data fit operations.
- Fixed display of the residuals plot through the fit wizard.
- Fixed reported confidence/prediction intervals values for weighted data fit operations.
- Fixed possible crashes when deleting 2D plot windows containing selected spectrograms.
- Fixed export of entire 2D plot windows.
- Fixed handling of project file names containing dot characters in their name.
- Fixed setting special tick colors for 2D plots.
- Fixed display of the number of major ticks in 2D plots via the axes dialog.
- Fixed export to PDF of 2D plots with texts having Symbol font.
- Fixed crash when recalculating values in columns with formulas containing invalid column names.
- Fixed saving/restoring of data fit information to/from project files.
2018/08/30 - QtiPlot 1.0.0-rc2 release available. New features and improvements:
Bug fixes:
- Fixed menus available for the active window.
- Fixed crash when trying to add error bars to a plot curve with no abscissas data column assigned.
- Fixed updating a 2D plot curve after a paste operation to its source data table.
- Fixed Shepard interpolation when converting random XYZ data tables with very small values to matrices.
- Fixed possible crash when importing Excel files via locally installed Excel on Windows.
- Fixed possible crash when trying to copy 2D plot objects on macOS.
- Fixed restoring of maximised 2D plots on Windows.
- Fixed selection of 2D plot widgets in "Plot details" dialog.
- Fixed import of stacked area curves from OriginLab.
- Fixed import of multisheet matrices from OriginLab.
- Fixed possible crashes when exporting 2D plots to PDF.
- Fixed export to PDF of 2D plot labels with 90 degrees angles.
- Fixed wrong aspect of minimised windows when opening projects.
- Fixed saving of statistic tables: None type columns were not saved correctly.
- Fixed bug in rendering 2D plot legends.
2018/05/03 - QtiPlot 1.0.0-rc1 release available. New features and improvements:
Bug fixes:
- Fixed restoring of the frame size for minimised windows when using Qt5.
- Fixed crash on macOS when deleting a plot layer after a right click on the layer button.
- Fixed sorting table columns together in descending order.
- Fixed bug in correlation/autocorrelation analysis.
- Fixed notifications about the modified project status after operations in the column properties dialog.
- Fixed possible crashes when exporting 2D plots to PDF via Python scripts.
- Improved the export to OriginC files.
2018/03/01 - QtiPlot 0.9.9.14 release available. New features and improvements:
- Added support for universal Linux snap packages which gives the possibility to use an unrestricted version of QtiPlot on most popular non .deb based Linux systems.
- The log() function now also returns the natural logarithm for the muParser interpreter.
2D Graphs:
Tables:
Python API:
Bug fixes:
- Fixed export to EPS/PS of 2D plots displaying scaled images.
- Fixed drawing of inward ticks for 2D axes presenting an offset with respect to the layer canvas.
- Fixed import of ASCII files in overwrite table mode: empty data cells are correctly cleared now.
- Fixed the initialisation of the the weighting coefficients when performing data fit operations with weighting method set to Arbitrary Dataset or Direct Weighting.
- Restore stacking options for the curves in a plot layer after a change of the axis scale type.
- Avoid crashes when exporting to PDF via the new export engine introduced in previous release.
- Fixed 2D axes synchronisation when creating graphs via the Plot Wizard.
- Fixed aspect of the first new 2D graph window when built using Qt5.
- Fixed engineering format for 2D axes: the micron symbol was not displayed.
- Fixed statistics on table rows: only the selected columns are taken into account.
- Fixed loading of error bar curves with abscissas taken from text columns.
- Fixed filling of the area bellow 2D plot curves.
- Fixed filling of the area between two 2D plot curves.
- Fixed loading of .qwt template files from Python scripts.
2017/11/03 - QtiPlot 0.9.9.13 release available. New features and improvements:
- Added real vectorial export of 2D plots to PostScript (*.ps) and PDF formats.
- Improved export of 2D plots to Encapsulated PostScript vectorial format (*.eps).
- Improved export of 2D plots to SVG.
- Export of animated 3D plots to movies (*.avi) is available now on all platforms.
- Added the possibility to customize the image quality when exporting 3D plots to AVI.
- Improved the quick help window: the search results are highlighted more visibly and also added two buttons for the next and the previous help pages.
- Improved double Y plots: the ticks for the left and right axes are now synchronised.
Bug fixes:
- Fixed export to PostScript of 2D ellipse symbols with size zero.
- Fixed possible crashes in import ASCII wizard.
2017/09/26 - QtiPlot 0.9.9.12 release available. New features and improvements:
- Added two new 2D plot styles: Color Mapped and Bubble + Color Mapped symbols.
- Improved import of OriginLab files and added support for importing old version format files (*.ORG).
- Added the possibility to enable/disable data margins via the 2D Plots tab of the "Preferences" dialog.
The margins are the space added before and after the range of data values along each axis scale.
- Update multilayer fonts after closing the font dialog launched via the fonts tab of the plot details dialog.
- In the fit wizard the weighting method is automatically set to "instrumental" if the selected data set has error bars.
- Updated Chinese translation.
Bug fixes:
- Fixed exporting of 2D plot texts at high resolutions.
- Fixed the calculation of the number of bins in the Frequency Count dialog.
- Fixed incrementing bin values in histograms.
- Fixed a bug in the "General Plot Options" dialog preventing the title of a 2D plot axis from being edited if the axis has just been enabled.
- Fixed a bug preventing error bars from being added to a 2D plot curve with abscissas from text strings.
- Fixed the display of the number of minor ticks in the 2D plot axes dialog.
- Fixed drawing of 2D data symbols for plots with very high canvas zoom.
- The "Preferences" dialog no longer exits after choosing the default font options on macOS.
- Fixed import of *.OTP and *.OTM OriginLab files (graph and matrix window templates).
- Fixed export to OriginC files.
2017/05/31 - QtiPlot 0.9.9.11 release available. New features and improvements:
- Introduced a mechanism that allows to trigger a recalculation for all data analysis operations when the data source is modified.
It is possible to specify the desired recalculation mode in the Preferences/Fitting dialog using the Recalculate list box.
- Improved statistic tables: the row interval as well as the source data columns/rows can be edited directly in the table.
- Improved Add/Remove curves dialog: the available data windows can be sorted alphabetically.
- Improved data fit using the "Instrumental" weighting method: added warning about divisions by zero.
- Added the possibility to choose the numerical format for the output of data analysis operations via the Preferences/Fitting dialog.
- Improved Python API: added support for find peak analysis filters.
- Improved import of layout windows from OriginLab project files.
- Improved import of OriginLab files: font sizes in 2D plots are correctly imported now.
Bug fixes:
- Fixed bug causing labels of 2D curves to move to incorrect positions after zooming.
- Fixed saving/restoring the last url visited in the quick help system.
- Fixed cloning of tables with masked data ranges.
- Fixed loading of error bars from empty table cells: their values are set to zero.
- Fixed maximising project windows when built with Qt5.
- Fixed scrolling in the Quick Help window when the "Preferences" dialog is opened.
- Fixed possible error in detecting the data range for analysis operations in 2D plots.
- Fixed bug when setting paramater range values in the fit wizard dialog.
- Fixed display of end range in Table statistics.
- Fixed behaviour of data selection tools when exchanging X/Y axes in 2D plots.
- Fixed notification of data changes in columns that have formula dependencies on other columns.
- Fixed wrong error message when setting the number of smoothing data points to 1 (no smoothing) for the moving window average method.
- Cell edited commands are no longer pushed to undo/redo history if the value of the table/matrix cell wasn't changed.
- Fixed one pixel offset when exporting 2D plots displaying a canvas frame and outside axes ticks.
2017/03/06 - QtiPlot 0.9.9.10 release available. New features and improvements:
- Improved TDMS files import dialog: the data preview plot is included into the dialog and may be shown/hidden by the user.
- Added the possibility to also define a special tick label for the end of a 2D plot axis.
- Added support for the import of PDF image files.
- Improved resampling of matrices using bilinear/bicubic interpolation.
- Better support for tiling/cascading project windows via Python scripts.
- Improved table to matrix conversion using the 2D binning method and also improved the look and feel of the corresponding user dialog.
Bug fixes:
- Fixed saving/restoring of the canvas background image for 2D plots.
- Fixed restoring of special tick labels.
- Fixed export of 2D plots to custom size images and the option to clip the space around plot layers enabled.
- Fixed export to OriginC files: special characters and diacritics are removed from window names.
- Fixed drawing of error bars: they no longer intrude into some the default symbols.
- Fixed updating the working directory path when importing files via the plugin system.
- Fixed restoring of function curves in the case of 2D plots with logarithmic abscissas.
- Fixed possible crash on macOS when opening a file from Finder.
- Fixed printing dialog on Windows 64bit systems.
2017/01/25 - QtiPlot 0.9.9.9 release available. New features and improvements:
Bug fixes:
- Check if LibreOffice is already running before starting it.
- Fixed import of NI TDMS files.
- Fixed setCellData function in Python API for tables.
- Fixed cloning of 2D plots.
- Fixed possible crashes on macOS after closing the 2D plot text/legend editor.
- Fixed crashes when trying to edit central axes in 2D plots.
- Fixed possible crash when removing 2D plot curves in a very particular case.
2016/12/12 - QtiPlot 0.9.9.8 release available. New features and improvements:
- Added support for high DPI screens.
- Added support for the import of OriginLab 2017 (9.4) projects.
- Improved export to Origin C files.
- Improved plot details dialog: lines/arrows in the 2D plot layers can also be customized via this dialog.
- Improved spectrogram values page in the plot details dialog: users can now resample the source data matrix in order to customize the resolution.
- The maximum number of major ticks can now be defined independently for each 2D plot layer.
- Improved Python API and added a new Column class that allows to directly manipulate table columns.
- Improved import of .csv ASCII files to tables.
- Improved keyboard interaction with tables: pressing the Enterkey on the numerical pad also moves the cursor one field down.
- Added the possibility to nest the dock widgets (the Project Explorer, the Results Log, the Scripting Console, etc).
- Improved double Y axes plots.
- Improved creation of auto axis titles in 2D plots.
Bug fixes:
- Ported QwtPlot3D library to QOpenGLWidget which fixes problems with 3D plot windows staying on top of other windows on macOS.
- Fixed drawing of 2D plot legends: symbols/texts for hidden curves are no longer displayed.
- Fixed drawing of 2D plot curves with spline line style when the layer XY axes are exchanged.
- Fixed drawing of line/arrows in 2D plots.
- Fixed changing matrix name for spectrograms in plot details dialog.
- Fixed import of images to existing matrices.
- Fixed removing matrices from 2D plots via the Add/Remove curve dialog.
- Fixed drawing of rectangles/ellipses onto 2D plots.
- Fixed bug affecting the maximum number of major ticks for a 2D plot axis.
- Fixed the calculation of the values in the covariance matrix reported by the Fit Wizard: the values are now scaled with Chi^2/doF when the option Scale Errors with sqrt(Chi^2/doF) is checked.
- Fixed mask data tools and drawing of masked points in 2D plot curves.
- Fixed two colors gradient editor.
- Fixed posible crash in Python scripts using Table.colData() function.
2016/10/04 - QtiPlot 0.9.9.7 release available. New features and improvements:
- Implemented a new plot type: indexed size symbols (Bubble).
- Improved speed when performing 2D FFT and filtering of matrices by using multithreading.
- Improved 2D XYAM vector plots: now it is possible to define a constant angle and/or constant magnitude.
- Improved import of OriginLab project files.
- Improved autocompletion support for Python scripting language.
- Improved 2D plot details dialog.
Bug fixes:
- Fixed setting of the minor ticks type for top axis via the Preferences dialog.
- Fixed changing of log scales: the number of major ticks no longer exceeds the maximum number defined in the user settings.
- Fixed opening of Python script files from the command line.
- Fixed unwanted trimming of white spaces and tabs in 2D plot texts.
- Fixed drawing of pixmap symbols in 2D plot legends.
- Fixed saving/restoring of Unicode symbols used for 2D plot curves.
- Fixed clipping when exporting to EMF on Linux/Mac OS.
- Fixed export of transparent pixmaps to EPS.
- Fixed crash when trying to import an ASCII file as new matrix.
2016/08/17 - QtiPlot 0.9.9.6 release available. New features and improvements:
- Added the possibility to export/load user settings to/from an .ini or .txt file. Old settings will be lost when upgrading to this release.
- Improved help system: help files are copied to the user's home folder in order to avoid the need for admin rights.
- Added FFT 2D filtering for matrices.
- Memory optimizations for 1D FFT.
- Improved export to EMF on Linux/Mac OS X: exported text has antialiased quality.
- Updated translation to Portuguese.
- Demo version can now be used for 30 minutes.
Bug fixes:
- Fixed the layout of the FFT filter dialog for the low pass filter type.
- Fixed scaling of FFT when performing the correlation/convolution of two data sets.
- Fixed autoscaling of 3D plots created from matrices.
- Fixed crash when trying to integrate matrices via the user interface.
- Fixed wrong clipping of text labels when exporting images to EPS format.
- Fixed cloning of statistic tables.
- Fixed possible crashes when opening the axis dialog of 2D plots.
- Fixed export of 2D plots with inverted axes titles to EPS format.
2016/07/19 - QtiPlot 0.9.9.5 release available. New features and improvements:
- Added the modulus operator (%) when evaluating expressions using muParser.
- Improved exchanging XY axes for 2D plots with stacked curves.
- Improved LaTeX equations editor: added the possibility to export the equations as raster images.
- Improved 2D linear scales: the user can now specify any number of minor ticks.
- Improved export of 2D plots to Origin C files.
- Improved handling of multiline expressions in column values dialog.
- Improved FFT filter dialog: added the possibility to choose a filter type.
- Added an escape sequence allowing to define custom colors in 2D text/legend objects.
- Added a color button to the text dialog allowing to insert a color escape sequence or a HTML font tag with a custom #RRGGB color.
- Added a new option to the 2D plot preferences dialog enabling the display of the legend items using indexed colors.
Bug fixes:
- Fixed restoring of waterfall plots as well as exchanging their XY axes.
- Mac OS X: fixed possible crash when performing auto recalculation of column formulas for non existing row indices.
- Fixed import of MySQL databases.
- Fixed crashes when exporting 2D function curves as Origin C files.
- Fixed clipping when exporting 2D plots to EPS format.
2016/06/22 - QtiPlot 0.9.9.4 release available. New features and improvements:
- Added the possibility to exchange XY axes for 2D plots.
- Implemented the possibility to add central axes (horizontal or vertical) to 2D plots.
- Improved user interaction with central axes: they can be drag-and-dropped with the mouse, moved using the arrow keys and deleted using the Delete key.
- Improved TeX Equation editor: now it is possible to open and compile full .tex files and to set a transparent background.
- Improved 2D filled area curves: now it is possible to use spline connections between data points.
- Added the possibility to customize the baseline value for 2D curves.
- Implemented the possibility to use linear gradients with more than two colours in order to fill the area beneath 2D curves.
- Added support for transparency when exporting/importing EMF images on Linux/Mac OS X.
- Improved baseline dialog: up and down arrow keys can now be used in order to fine tune the position of the baseline points.
- Improved the user manual and added the baseline dialog to the quick help system.
- Added the possibility to remove selected 2D curves using the Delete key.
- Python scripting: added a new evalAt method allowing to evaluate an interpolation spline at a user defined abscissa.
- Added function interp for linear interpolation of table data sets.
- Added function rms calculating the root mean square of table data sets.
- Improved the layout of the actions in the plot 3D toolbar.
- Improved format menu for 3D plots.
Bug fixes:
- Fixed filling of the area between 2D curves.
- Fixed export to EMF on Linux/Mac OS X.
- Fixed opening of image files from Finder on Mac OS X.
- Fixed import of 2D vector curves from OriginLab files.
- Fixed possible crashes when performing linear or polynomial fits via Python scripts.
- Fixed restoring of orthogonal 3D plots from project files.
- Fixed drawing of inward ticks for 2D plots.
2016/05/09 - QtiPlot 0.9.9.3 release available. New features and improvements:
- Added more arrow head shapes for line objects in 2D plots.
- Improved "Line Options" dialog: it is now possible to customize all line/arrow objects in a project with a single click.
- Added the possibility to limit the number of major ticks for a 2D plot axis via the "Preferences" dialog ("2D Plots | Ticks" tab).
- Made possible to use file names containing Unicode characters when exporting 2D plots to .emf format on Mac OS X.
Bug fixes:
- Fixed copy/paste from/to a 2D plot curve selected data range when the table default separator is not the TAB character.
- Fixed display of R-square value to log window after data fit operations.
- Fixed opening of compressed project files with extension .gz created on Mac OS X >= 10.10.
- Fixed issue with label of bottom axis not fully visible.
- Fixed plot associations dialog.
- Fixed drawing issue with overlaping symbols in 2D plot legends.
- Fixed pixel line profile tool when user language is not English.
- Fixed new 2D line/arrow not being visible during the drawing process on Mac OS X.
- Fixed customization of all keyboard shortcuts via the preferences dialog.
- Fixed saving/restoring of curve linewidth.
- Fixed drawing of axes arrows and improved axes dialog.
- Fixed initialization of note windows on Linux.
- Fixed export of 2D plots as Origin C files. Added support for exporting arrow head shapes.
2016/03/21 - QtiPlot 0.9.9.2 release available. New features and improvements:
- Added the possibility to draw arrows at the end of central 2D plot axes.
- Implemented the possibility to set a fixed aspect ratio for 2D plot canvases.
- Added the option to clip space around plot layers when exporting 2D graph windows.
- Added a speed option (configurable via the 2D Plots|Speed tab of the Edit|Preferences dialog) allowing to disable mouse tracking for 2D curves.
- Improved import ASCII files dialog so that it accepts non-word characters and no longer blocks the user interface during the import operation.
- Improved set column values dialog: the table is automatically resized if the user enters a row number greater than the existing number of rows.
- Improved export to Origin C files: added support for exporting masked data ranges and Unicode strings from graph windows.
- Export of 3D plots to .avi no longer blocks the user interface.
Bug fixes:
- Fixed image export of multi-layer 2D plots.
- Fixed 2D plot symbol dialog: included "No Symbol" option.
- Fixed possible crashes when deleting multi-peak fit curves via the fit wizard.
- Fixed data reader tools for 2D plot curves with more than 3000 data points.
2016/02/14 - QtiPlot 0.9.9.1 release available. New features and improvements:
- Added the possibility to export QtiPlot projects as Origin C files that can be compiled and executed by OriginLab.
- Added support for the import of Origin 2016 files.
- Improved import of matrices and layout windows from OriginLab projects.
- The information about constant fit parameters is now saved to the user .fit files.
- Added the posibility to define special tick labels in 2D plots.
- Added the possibility to define numeric precision and format for spectrogram labels.
- Move 2D plot line/arrow objects using the arrow keys.
- Improved Python API: it is now possible to iterate over the list of all texts/legends in a 2D plot layer.
- Added a context menu (right-click) for the main project area allowing to add new windows.
- Added new "Akima Spline" line connect style for 2D plot curves.
- Added the probability density function for the binomial distribution (binopdf).
- Added new distribution curve types for histogram/box-and-whiskers plots: Gamma, Binomial and Kernel Smooth.
- Implemented insert and delete cell selection for tables.
- Improved drawing speed for 2D large datasets.
- Improved custom keyboard shortcut editor in the user preferences dialog.
Bug fixes:
- Fixed possible crash when deleting curves from 2D plots also containing spectrograms.
- Fixed bugs in image export dialog.
- Fixed clipping of tick labels when exporting 2D plots to LaTeX.
- Fixed keeping track of working directory path when saving a project.
- Fixed display of tick labels for 2D axes having a user formula.
- Fixed crashes when working with 2D images on Mac OS X systems.
- Fixed restoring of 2D plot axes with color scales.
- Fixed import of Excel files.
- Fixed 3D plot dialog: now it is also possible to customize the border line for 3D bars.
- Fixed restoring the settings of 2D plot axes in some very specific cases.
2015/11/09 - QtiPlot 0.9.9 final release available. New features and improvements:
- Improved Python API: added methods allowing to get the list of selected windows/folders in the project explorer.
- Improved opening of image files.
- Improved drawing of EMF images created by QtiPlot on Linux and Mac OS X platforms.
- Improved "Table | Recalculate" menu action: if the active table doesn't have any selected cells then it is recalculated entirely.
- Added a "Recalculate All | Table" menu action.
- Improved find peaks tool to also work in the case of analytical function curves.
- Added the possibility to run a Python script repeatedly at a user specified time interval.
- Improved data interpolation: data sets containing points with identical x values are also accepted now.
- Redesigned several dialogs assuring a faster and more reliable workflow: ASCII export dialog, image export dialog and the ASCII import dialog.
- File open/save dialogs display a native look and feel for each operating system.
- Added the possibility to customize the auto-update feature for all legends in 2D plot windows via the "Plot details" dialog.
- Improved import of column formulas from OriginLab projects.
Bug fixes:
- Fixed possible crash in baseline dialog caused by non-monotonic data sets.
- Fixed possible crashes when closing QtiPlot windows during execution of Python scripts.
- Fixed 2D plot symbol and color selection issues on Mac OS X.
- Fixed renaming of tables affecting 2D plots with axis type set to "Tick-indexed dataset".
- Fixed unwanted deletion of plot curves when a table with a name containing the name of a data source table of that plot is closed.
- Fixed regression on Windows systems: plotting data selection from Excel embedded windows works again.
- Fixed bugs caused by importing ASCII files containing special control characters.
- Fixed export of tables/matrices to Open Document Spreadsheet format (.ods).
- Fixed export of 3D plots to raster image formats on Unix systems.
- Fixed export of 3D plots to .avi video format on Linux.
- Fixed importing 2D plots from Origin projects: the default settings for the graph window background do not interfere anymore with those of the imported objects.
- Fixed drag and drop of data files on Mac OS X >= 10.10.
2015/09/07 - QtiPlot 0.9.9-rc16 new features:
Bug fixes:
- Fixed crash on Mac OS X when opening projects by double-clicking on the project file icon.
- Fixed display of negative sign in 2D plot axis labels for some locale settings.
- Fixes saving/restoring of file path connections in Note windows.
- Fixes drawing of error bars in the case of log scale.
- Fixed restoring of plot font sizes from project files in the case of a user environment with magnified texts.
- Fixed drawing artifacts when panning a 2D plot.
- Fixed behavior of subtract straight line tool.
- Fixed save file message being shown twice.
- Fixed restoring of axes labels in the case of 2D box plots.
- Improved range detection for histograms.
- Fixed possible crash when showing fit residuals and confidence limits in fit wizard.
- Fixed crash when plotting floating bar/column or fill area graphs from tables not having an X column.
- Fixed bugs in quick help system and improved the user manual.
Plug-ins:
- Fixed import of National Instruments TDMS files.
- Fixed import of EMF images on Mac OS X/Linux systems.
- Improved import of 2D plots from Origin files: page resolution is taken into account and plots are imported with exact sizes and positions for the different objects.
Axis titles and Greek characters are also correctly imported now.
2015/04/06 - QtiPlot 0.9.9-rc15 new features:
- Added a 2D plot data points annotation tool.
- Reorganized 2D plot toolbar and added a new toolbar for to the manipulation of plot layers.
- Added support for the import of EMF and WMF images.
- Improved loading of SVG images.
- Improved usability: floating toolbars were added a close button.
Bug fixes:
- Fixed bug in subtract line tool occurring in the case of zoomed in 2D plots.
- Fixed handling of Unicode in Python scripts.
- Fixed possible crashes when deleting columns from tables monitored by other statistic tables.
- Fixed handling of the network connection on Windows 64-bit systems.
- Fixed crash when pressing the mathematical functions button in set values dialogs on Mac OS X versions lower than 10.9.
- Fixed the encoding of LaTeX equations when using MathTran online compiler.
OriginLab import plug-in:
- Added support for the import of OriginLab files containing EMF images on Linux/Mac OS X.
- Fixed crash when importing OriginLab files containing EMF images on Windows 64-bit systems.
2015/02/25 - QtiPlot 0.9.9-rc14 new features:
- Implemented a peak finding tool.
- Added two Pseudo-Voigt peak profiles to the multi-peak fit tool.
- Improved initial guessing of peak profile parameters when performing multi-peak analysis.
- Added the possibility to perform multi-peak fits via Python scripts.
- Improved table statistics: it is now possible to choose the type of statistical computation needed for each column.
- Improved the integration dialog for tables.
- Added the possibility to set a preamble LaTeX file to be used when adding 2D plot equations (via File Locations tab in "Preferences" dialog).
- Implemented the possibility to paste transposed values from clipboard to table/matrix windows.
- Improved user manual and quick help system for some user dialogs.
Bug fixes:
- Fixed the export of invisible plots using the "File | Export Graph | All..." menu.
- Fixed updating a 2D plot curves stack after modifying the data points of a curve or the curves order.
- Fixed crashes in subtract baseline dialog on Mac OS X and improved the selection tool.
- Fixed bug in drag 2D plot curve tool.
- Fixed crashes when performing undo/red operations for new table columns.
- Fixed tracking of the project window positions after move events.
- Small style fixes for Mac OS X.
Plug-ins:
- Fixed the export of 2D plots to EPS and reduced the size of output *.eps files.
2014/11/24 - QtiPlot 0.9.9-rc13 new features:
- Redesigned the find window dialog in the project explorer.
- Show window preview when the cursor is moved over the name of a graph or matrix in the project explorer.
- Improved help system for dialogs with multiple tabs.
- Implemented 3D vectors and line + symbols 3D plots.
- Improved drawing of 3D cone symbols.
- The 3D plot dialog was improved in order to be more user friendly.
- Added plus-minus and division signs to the Unicode mathematical character table.
- Improved drawing of error bars in the case of plot curves displaying Unicode data symbols.
- Added two more standard symbols for 2D plot curves: pentagon and five-pointed star.
- Added the possibility to recalculate data values for all tables in a folder or in a project as a single operation.
- Implemented a new more user friendly 2D symbol style picker tool.
- Added a new method to create error bars for a 2D plot curve by calculating the square root of each data value.
- Added the possibility to specify a default error bars style via the "Preferences" dialog using the "2D Plots | Error Bars" tab.
- Improved Set Column Values dialog to accept multiline input and to handle indentation when using Python scripting.
- Display tool tip for function syntax in Set Column Values dialog and Note windows by double-clicking inserted function name.
- Added the possibility to enable/disable data sorting via the fit wizard.
- Improved results log window information after data fit operations.
- Added a muParser script function to calculate the standard deviation of a data column: SD(colName, startRow, endRow).
Bug fixes:
- Fixed crash when opening the 3D plot dialog in the case of an empty plot window.
- Fixed drawing of 2D plot curves with clipped data points.
- Fixed display of 2D axes labels in the case of engineering scales.
- Fixed drawing of inward minor ticks for 2D plot axes.
- Fixed drawing of 2D plot axes and improved drawing of legends.
- Fixed loading of 2D plot curves with double log scales.
- Fixed crash when opening the properties dialog for histograms built from matrices.
- Fixed crash when trying to add error bars to histogram curves created from matrices.
- Fixed display of distribution curves for histograms created from matrices having empty cells.
Plug-ins:
- Added support for the import of Origin 2015 files.
- Improved import of 2D/3D plot symbols from OriginLab projects.
- Fixed import of 3D ribbon plots from OriginLab projects.
- Fixed crash when importing OriginLab files containing grouped drawing objects.
- Fixed export of table windows to Excel.
2014/07/30 - QtiPlot 0.9.9-rc12 released:
- Added the possibility to use the apparent plot values for linear and polynomial fitting, according to the current axis scales.
- Improved drawing of 2D functions for log abscissa scales.
- Implemented the possibility to select the way graphics are stored to clipboard. The image format can be customized via the "Preferences" dialog using the "General|Application" tab.
- Fixed export of 2D graphics to SVG.
- Setting the name of the result table in the ANOVA dialog was fixed.
- Fixed crash when cloning plot windows that contain FillArea curves.
- Added the possibility to specify a custom fill baseline for 2D plot curves.
- Implemented the possibility to define default color, numeric format/precision and rotation angles for axis tick labels in 2D plots.
- Improved handling of row selection in the "Set Column Values" dialog.
- The column separator from import ASCII dialog is from now on used only for importing data while the default column separator in the tables preferences dialog is used for copy/paste operations.
- Updated German translation (many thanks to Ara Schorscher-Petcu).
Plug-ins:
- Improved import of .opj (OriginLab) projects.
- Fixed import of .ogg files (OriginLab graph template).
- Improved export to .emf format on non Windows platforms.
- Added a new plug-in enabling the export of 2D graphics to "pure" vectorial .eps format. The default solution provided by the Qt library is still available by checking the option "Export as embedded image" in the export graph dialog.
2014/04/30 - QtiPlot 0.9.9-rc11 released:
- Fixed saving/restoring of internal images in 2D plots.
- Improved plotting from templates.
- Fixed saving/restoring the fill color opacity for 2D plot curves.
- Improved deployment method: translation files are now embedded into the binary file.
- Improved user dialogs for 2D functions/3D surfaces, for setting table/matrix values and for extracting data from tables.
- Fixed duplication of pie plots.
- Fixed geometry of new pie plots on Mac OS X.
- Fixed behavior of Note windows on Mac OS X.
- Added support for customizing the background of 2D plot windows.
- Enabled the export of 3D plot animations to .avi for Linux and Mac OS X platforms.
- Python API: added more getter functions for 2D plots.
- Updated Italian translation.
Import of OriginLab .opj files:
- Improved the import of box and wiskers curves.
- The background of 2D plot windows is now correctly imported.
- Fixed a regression affecting the import of column formulas.
- Improved the import of column formulas: column names are now enclosed by double quotes.
2014/03/07 - QtiPlot 0.9.9-rc10 released:
- Implemented the posibility to increment the fill collor for every column/bar in column/bar charts.
- Improved file dialogs for Mac OS X/Linux: the user gets easy access to all USB drives from the url list.
- Improved editing of 3D surfaces: buttons displaying the functions menu were added to the dialog.
- Implemented the possibility to merge 2D graph windows.
- Fixed rendering of matrix images.
- Added the possibility to save/load a custom color map to/from a XML file.
- Improved editing the coordinates of 2D plot objects for axes with date/time scales.
- Added support for Retina displays on Mac OS X.
- Improved the project explorer: now it is easy to copy/paste a folder or a list of windows.
- Added the possibility to work with native Excel workbooks on Windows.
- Faster import of Excel files and export to Open Document Spreadsheets (".ods" files) via an existing installation of LibreOffice. Users should install LibreOffice and update the path to the soffice executable via the "Preferences" dialog.
- On Windows, if Excel is installed, QtiPlot also imports charts from ".ods" files.
- Added new plot types: "Histogram + Probabilities", "100% Stack Column", "100% Stack Bar" and 100% Stack Area".
- Added the possibility to display a distribution curve for histogram/box and whiskers plots.
- Reorganized matrix windows toolbar.
- Implemented the possibility to add comments to each project window.
- Improved the window properties dialog.
- Fixed restoring of the numeric format for the 2D plot axis labels from project files.
- Fixed the import of the table column names from ASCII files.
- Fixed the export of minimized 2D plot windows.
- Fixed the export of error bar curves from minimized plot windows.
- The last url viewed in the quick help window is saved/restored between two sessions.
- Fixed crash when changing the plot type of a 2D function curve.
- Improved icons.
Plug-ins:
- Added support for importing National Instruments TDMS files.
- Added support for exporting 2D graphics to Windows Metafile format (.wmf) on Windows platforms.
- Improved the import of .opj (OriginLab) projects.
- Improved import of Excel/OpenOffice/LibreOffice files.
Python API:
- Added a new "moveTo()" method for moving project windows to folders.
Translations:
- Updated French, Spanish and Romanian translations.
2013/11/22 - QtiPlot 0.9.9-rc9 released:
- Added a toolbar menu button for new function 2D/3D plots.
- Added support for gradient filling in 2D plots.
- Added drag and drop support for Note windows and for the Script Window.
- Improved editing process in Note windows/Script Window.
- An error message is shown when the user enters values with wrong decimal separators.
- Improved the behavior of the text labels for 2D plot curves so that it is more compatible with OriginLab.
- Improved saving/restoring of font sizes used in plot titles.
- Fixed restoring of 2D plot axis titles.
- Fixed export of 2D plots to vector formats: the last characters in legends were sometimes cut off.
- Fixed the built-in value for the Boltzmann constant (k).
Plug-ins:
- Added support for the import of OriginLab 9.1 .opj project files.
- Improved import of Excel/OpenOffice/LibreOffice files.
Translations:
- Updated French and Romanian translations.
- Fixed loading of a translation from the command line.
QtiPlot 0.9.9-rc8 changes:
- Added support for stacking 2D plot curves.
- Added new plot types: "Fill Area", "Stack Area", "Stack Lines by Y Offsets", "Column + Labels", "Floating Column", "Floating Bar" and "2D Black&White Pie Chart".
- Implemented the posibility to increment the fill pattern for every column/slice in bar/column/pie charts.
- Added the posibility to fill the area under a 2D curve with a color different of the pattern color.
- Reorganized the "Plot" menu and improved the "Table" plots tool bar.
- Display changelog via the "Help" menu.
- Improved autoscaling for log scales.
- Added the possibility to choose the active layer in the 2D axes dialog.
- Reimplemented the possibility to raise/lower 2D plot curves.
- Data sets are now sorted before performing a data fit.
- Show fill pattern detail in the plot legend for area curves.
Python API:
- Added support for stacking 2D plot curves.
- Fixed the 2D plot methods in order to accept integer tuples with the column numbers to be displayed.
QtiPlot 0.9.9-rc7 changes:
- Highlight selected curve in 2D plots.
- Support for full screen graph windows.
- The default number format for tables can be customized via the "Preferences|Tables" dialog tab.
- Implemented feature request #5682 ("Import filter for Paste from Clipboard"): the column separator set via the "Preferences|Tables" dialog tab is from now on used to import the data.
Plug-ins:
- Added import of .mat (Matlab) files.
- Improved the import of .opj (OriginLab) projects.
Python API:
- Added getter functions for the title and labels of 2D plots.
- Added support for the data range selection tool.
2013/11/22 - Support for the import of OriginLab .opj files created with version 9.1 is now available for our customers.
2013/10/24 - Packages for Ubuntu 13.10 are now available for our customers.
2013/07/07 - The possibility to import Matlab .mat files is now available for our customers.
2013/04/29 - Packages for Ubuntu 13.04 are now available for our customers.
2013/01/27 - Improved support for the import of OriginLab .opj files is now available for our customers.
2013/01/02 - The possibility to import Excel 2003 .xml files as well as flat open document spreadsheet files (.fods) is now available for our customers.
2012/12/12 - Improved support for the import of Excel .xlsx files is now available for our customers.
2012/11/09 - The possibility to import OriginLab 9.0 projects is now available for our customers.
Support for importing MySQL databases and for running SQL queries was also added.
2012/05/03 - A native 64 bit QtiPlot version for Windows 64-bit operating system is available for our customers.
2011/11/02 - QtiPlot 0.9.8.9 released:
Improvements:
- Improved support for the Dock menu on Mac OS X.
- Improved restoring of statistic tables.
- Improved handling of error messages in Savitzky-Golay smoothing filter.
- Improved plotting of 2D plot layers with shared axes.
- Improved error bar handling when plotting a table column selection.
- Implemented feature request #5451: "Do not expand tree in Project Explorer".
- Implemented feature request #5458: "Fit wizard remove only fits from session".
- Updated translations: Italian (thanks to Renato Rivoira), German (thanks to Daniel Schury) and Romanian.
- Updated Italian manual thanks to Renato Rivoira.
Bug fixes:
- Fixed crash when opening old projects containing spectrograms.
- Fixed duplication of 2D plots with respect to the synchronization of scales.
- Fixed speed issues in matrices and removed size limitations in matrix size dialog.
- Fixed export of minus sign to LaTeX.
- Fixed possible crash when resetting the default options via the preferences dialog.
2011/09/02 - QtiPlot 0.9.8.8 released:
This is a bug fixing release:
- Improved import of Origin projects.
- Improved drawing of line symbol and added the possibility to use tabulator in 2D plot legends.
- Fixed clipping of top/bottom axis labels in 2D plots.
- Fixed saving of major ticks for 2D plot axes.
- Fixed restoring of 3D plots.
- Fixed export to SVG of texts in 3D plots.
- Fixed differentiation from table columns (the new plot was empty).
- Fixed paste selection in tables.
2011/07/14 - QtiPlot 0.9.8.7 released:
This release brings many improvements:
- The import of OriginLab projects was highly improved: all versions from Origin 4.1 to 8.5.1 are now supported.
- Improved import of Excel files: it is now possible to import them via OpenOffice/LibreOffice.
- Improved the matrix resample dialog: now it is possible to freely resize a matrix.
- Improvements and bug fixes to 2D FFT dialog. Added support for 2D FFTs to Python scripting engine.
- Improved handling of linear color maps.
- Improved image profile tool: added the possibility to average over several pixels.
- Improved the 3D plot dialog: added the possibility to view/modify axes rotation.
- Added support for the regular modified cylindrical Bessel functions (I0, I1, In).
- Implemented the possibility to draw grid on top of data in 2D plots.
Bug fixes:
- Fixed restoring of maximized 2D plot windows.
- Fixed a bug leading to clipped scale numbers when printing in high resolution.
- Fixed table calculations envolving date/time columns.
- Fixed resizing of matrix windows in image view mode: the image is not distorted anymore.
- Fixed crash when deleting several project folders at once.
- Fixed spurious white page in print all plots function and added a key shortcut to it.
2011/05/09 - QtiPlot 0.9.8.6 released:
This release brings many new features and improvements:
- Waterfall plots were completely refactored and now it is possible to display multiple waterfall plots in the same plot window.
- Improved the script window.
- Added a new integration dialog (feature request #005293).
- Added an image preview in the export dialog (feature request #005311).
- Added the possibility to compress images exported to the TIFF format (feature request #005313).
- Improved internal handling of date/time values.
- Improved table sorting.
- Improved import ASCII dialog so that all lines containing a custom string can be ignored.
- Added the possibility to enable/disable the display of gaps in 2D plot curves generated from table columns with empty cells.
- Improved 2D plot details dialog: added the possibility to hide/show curves and plot objects and the possibility to edit the data range of plot curves.
- Improved drawing of axis breaks.
Bug fixes:
- Fixed import of ASCII files to matrices.
- Fixed import of table templates.
- Fixed import of empty table values from ASCII files.
- Fixed sorting of date/time data sets.
- Fixed restoring of table statistics.
2011/03/18 - QtiPlot 0.9.8.5 released: this release brings support for the import of Origin 8.5 projects and fixes some major bugs.
2011/02/22 - Italian version of the user manual available thanks to Renato Rivoira.
2011/02/18 - Final QtiPlot 0.9.8.4 version released:
This release highly improves statistical analysis capabilities of QtiPlot. A lot of advanced statistical tests were added:
- Normality test (Shapiro-Wilk).
- Student's t-Test with one or two samples.
- ANOVA tests (one-way and two-way).
- Chi-square test for variance.
- For statistical purposes a normal random generator was added.
The plotting capabilities of QtiPlot were also improved:
- A canvas background image can now be displayed for 2D plots.
- 2D plot curves can now display custom images as data point symbols.
- Value labels can now be displayed for box and whiskers plots and for histograms.
- The mouse interaction with 2D plot layer elements has been improved.
- The scale limts for 3D plots can now be adjusted outside the plot data range.
- Enabled the possibility to add several 2D curves having the same column data source.
General improvements:
- Implemented an import/export plugin interface.
- Added support for the import of databases: SQLite 3 (.db), dBase (.dbf) and Microsoft Access (.mdb) files can now be easily imported and visualised.
On Windows, we also provide support for Microsoft Access .accdb files via ODBC.
- The import of Excel workbooks was fixed.
- Added export of tables/matrices to Open Document Spreadsheets (.ods) and to CSV format.
- The Python scripting engine was improved.
- The import of OriginLab projects was improved.
- The integration of analytical functions uses an improved method.
- Stephen Besch has done a lot of work on the user manual.
New translations:
- Added an Italian translation thanks to Renato Rivoira.
- Manolis Stefanis provided a Greek translation.
- An incomplete Portuguese translation is also available.
2010/10/12 - QtiPlot 0.9.8.3 released:
A lot of new features are available in the matrix module:
- Added support for expanding/shrinking matrices using bilinear/bicubic interpolation.
- Matrices can now be smoothed using bilinear interpolation.
- Implemented table to matrix conversion for sparse XYZ data.
- Improved table to matrix conversion for uniform XYZ data.
This release highly improves the QtiPlot/Python scripting engine:
- Standard Python scope rules are now honoured.
- Python API for 2D plots was improved: support was added for error bars, box and whiskers plots, pie plots and vector curves.
- Added the possibility to run all Python scripts in a user defined folder on QtiPlot startup.
- QtiPlot can also be run in server mode.
General improvements:
- The import of OriginLab projects has been greatly improved.
- Improved auto completion: table column names are also suggested to the user.
- Improved output of the FFT routines.
2010/09/02 - QtiPlot 0.9.8.2 released. This is a bug fixing release:
- A bug affecting changing of the scale type in 2D plots was fixed.
- Multiple columns selection in tables using the "Shift" key was fixed.
- Restoring texts from OriginLab projects was improved.
- Now it is possible to reset the default options via the "Preferences..." dialog.
- By default QtiPlot now opens the last used project.
- The confirmation dialog for updates searching can now be disabled.
- The user manual was improved.
2010/08/26 - QtiPlot 0.9.8.1 released:
This release improves the user interface for 2D plots:
- Now the user has the possibility, via the 2D plot dialog, to edit/delete all other plot objects besides curves and also to rearrange the curves.
- The possibility to specify the axes for the new curves in the "Add/Remove curves..." dialog was added.
- Now it is possible to specify a default behavior for the plot grid using the "Preferences..." dialog.
- The possibility to disable antialiasing for 2D plot curves displaying large datasets was also added.
- The look and feel of the baseline dialog was improved.
Other important improvements concerning 2D plots are:
- Now QtiPlot correctly renders stacked bar plots.
- The export of 2D plots to vectorial formats was fixed.
- Support was added for exporting 2D plots to the Enhanced Metafile Format (.emf) on Unix-like systems.
General improvements:
- When a single ascii file is dragged and dropped onto QtiPlot, the "Import Ascii..." dialog pops-up.
- Changing the axes range in 3D plots was fixed.
- A few other minor bugs were fixed.
2010/06/29 - QtiPlot 0.9.8 released:
- This release highly improves QtiPlot's interoperability with Microsoft Excel:
- Tables/matrices can now be exported as .xls files.
- The import of Excel spreadsheets was improved.
- On Windows, if Excel is installed on your computer, QtiPlot also imports the charts from your workbooks.
- The import of Origin project files was also highly improved.
- The look and feel of the fit wizard was improved.
- The import ASCII wizard was also improved: now the date/time format of data columns can be easily specified by the user during the import process.
- A lot of work has been done in order to improve the 2D plotting and data analysis capabilities in QtiPlot:
- A baseline tool is now available.
- The possibility to raise/lower objects in the plot window was implemented.
- Support for defining a prefix/suffix for axis labels was added.
- The export of plots containing axis breaks was fixed.
- For FFT operations the evolution of the phase plot is now displayed together with the amplitude.
- It is now possible to save single QtiPlot windows as stand-alone project files.
- Two new functions (MIN and MAX) were added for calculations using table columns.
- The Python scripting engine was improved.
- A few other minor bugs were fixed.
2010/04/22 - QtiPlot 0.9.7.14 released:
- This release highly improves the import of Origin project files: all versions starting with 6.0 are now fully supported.
- New analysis tools for 2D plot curves were added: a subtract straight line tool and a subtract reference data tool.
- A new extract worksheet data dialog was added allowing users to easily filter table values.
- Improved the ASCII import dialog: now it is possible to specify the type of data to be imported.
- Implemented automatic axes labeling for 2D plots.
- The import of Excel spreadsheets with date/time cells was improved.
- Improved the 2D plot dialog and the arrange layers dialog.
- Fixed a few minor bugs.
2010/03/17 - QtiPlot 0.9.7.13 released:
This release highly improves 2D plotting:
- Now every aspect of a curve can be predefined by the user via the curves tab in the preferences dialog.
It is also possibile to customize the default list of curve colors and symbols.
- With the newly added support for transparency in filled curves you can realize even more beautiful graphs.
- Added the possibility to link the X axes of all layers in a plot window.
- Implemented the possibility to hide first/last ticks and labels of a plot axis.
- Improved autoscaling when using log scales.
- Added the possibility to define a custom grid of plot layers from selected table columns.
- It is now easier than ever to create custom grids of layers using the improved Arrange layers dialog.
- Fixed exporting of legend symbols.
Improved the import ASCII wizard:
- Now you have the possibility to set custom file type filters in order to import your special extension files.
- QtiPlot now remembers your preferred size for the import wizard.
- When importing a file, the name of the import window is now set to the base name of the file.
General improvements:
- Improved Windows menu.
- The layout of the explorer dock window was improved for a better usage of the main window space.
- Implemented the possibility to set the numeric format and precision for the 3D plot axes.
Bug fixes:
- Fixed crash with selected line/arrow.
- Fixed behavior of "Quit" action and of the data reader tool arrow keys on Mac OS X.
- Fixed crashes in 3D plots from empty matrices/table columns.
2010/02/09 - QtiPlot 0.9.7.12 released.
This release brings a lot of new features. The most important ones:
- Improved printing of 3D plots.
- Localization was added to muparser engine (upgraded to muParser 1.32).
- Implemented feature request #4887: open .qti project files from Finder on Mac OS X.
- Added two new functions (SUM and AVG) to the column values dialog allowing to easily calculate the sum or the mean of a range of cells in a table column.
This release also improves 2D plotting:
- Added the possibility to define a default spacing between ticks and labels.
- Fixed autoscaling of fonts.
- Added user information messages to multi-peak fit tool.
- Implemented feature request #004589: graph canvas size determined in Preferences dialog.
- Added scientific label format with german multiplication sign (thanks to Michael Roemer).
- Improved auto binning in histograms.
Several dialogs were highly improved:
The Python scripting engine was improved:
- Auto-completion: parentheses are now automatically added after functions.
- Added the possibility to set default layer preferences when adding a new layer.
- Improved handling of spectrograms.
- Added support for the import of single sheets from ODF spreadsheets.
Bug fixes:
- Fixed crash in interpolation.
- Fixed bug #016656: no transparency for exported .png files.
- Fixed drawing of error bars from table columns with empty cell values.
- Fixed bugs in image profiles plot tool.
2010/01/05 - QtiPlot 0.9.7.11 released. Changes:
This release brings a lot of new features. The most outstanding ones:
- Easy import of data from Excel workbooks (.xls files) and from Open Document Format spreadsheets (.ods files).
- Lowess data smoothing (thanks to Jonas B梨꼑r).
- QtiPlot now recognizes a lot of fundamental constants: the user can type pi, Pi, e, c, h, hbar, k, Na, g, etc... in a spin box and the constant is automatically calculated
(see the user manual fore more details).
This release also improves 2D plotting:
- Implemented an Origin-like image profile plot tool.
- Added two new zoom tools for horizontal and vertical zooming/panning.
- Added two format options for time scales: "M" (used to display minutes as: h*60 + m) and "S" (used to display the total number of seconds).
- Improved copy/paste of plot layers.
- Improved export to the SVG format.
- Modified the layer geometry dialog so that it operates on the layer canvas area, thus making the alignment of layers a lot easier.
- Added the possibility to customize x/y zero lines in an Origin-like manner: they have the same pen as the yLeft/xBottom axes.
- Fixed the behavior of data reader tools with respect to non numerical data.
The look and feel of several dialogs was highly improved:
A lot of work has been done on the Python scripting engine and on the scripts editor:
- Added support for loading .ui files created by QtDesigner into Python scripts.
- The Python/R interface was highly improved thanks to Jonas B梨꼑r.
- The API was improved so that now it is easier to perform data analysis operations on 2D plot curves via Python scripts.
- Added parentheses matching highlighting to the scripts editor and improved auto completion: window names, Python keywords and available mathematical functions are now suggested by the completer.
Bug fixes:
- Improved opening of project files.
- Fixed deletion of project folders via the project explorer.
- A lot of minor bugs were fixed.
2009/10/08 - QtiPlot 0.9.7.10 released. Changes:
This release brings a lot of improvements to 3D plotting:
- The QwtPlot3D version used by QtiPlot was upgraded to the last version of gl2ps (1.3.4).
- The export of 3D plots to vector formats was highly improved: now it is possible to choose a custom export size.
- The grids, both major and minor, can now be fully customized.
- The axes labels can now be drawn parallel to the axes.
- The 3D plots dialog is more user friendly.
- The context menu for 3D plots was also improved.
- Fixed a bug affecting the restoring 3D plots.
This release also improves 2D plotting:
- Now the user has the possibility to attach plot objects to the
layer scales or to the window page.
- Error bars can be succesfully added to curves using dates/time as x axis.
- A bug affecting the scales and the drawing of side lines in waterfall plots was fixed.
- Another bug affecting the mouse interaction with the plot layers was equally fixed.
The scripting interface was highly improved:
- Multi-tab editing of scripts was implemented.
- The scripting menu was improved and a new tool bar for note windows was added.
- The user interaction with the line numbers display was improved.
Other bug fixes:
- Fixed possible crash when opening statistics tables from older .qti projects.
- Fixed a bug affecting the use of the "cell(i,j)" function when setting matrix values.
2009/09/14 - QtiPlot 0.9.7.9 released. Changes:
This release brings a lot of improvements on the 2D plotting side:
- Added a speed mode for large data sets. The filtering of the 2D curves is based on the Douglas Peuker algorithm.
- Implemented the possibility to skip data points when drawing curves with
error bars or
lines and symbols.
- Now it is possible to edit the format for all curves in a project with just a few clicks.
- The add/remove curves dialog can be used to easily change the order of the curves/items.
- Added support for ln, Log2, Reciprocal, Probability and Logit scales.
- Changed the behavior of the layers resizing tool so that only the plotting area is selected (Origin-like behavior).
- Implemented direct plotting of table columns and matrices via drag and drop.
- Implemented stack bar/column plots.
- The automatic layout of plot layers was highly improved.
- Improved waterfall plots.
- The export of 2D plots to SVG and EMF was enhanced with the possibility to choose a custom output size.
- Fixed bug in printing 2D plots with crop marks.
- Fixed bug #015932: "Right Axis Title in 2D Plots is not handled correctly".
This release also brings seamless integration with LaTeX:
- Thanks to the the TikZ/Pgf graphic systems, all plots can now be exported
as .tex files via the QTeXEngine library.
This brings full LaTeX support for text labels including LaTeX-math mode and makes straightforward the integration of complex
mathematical expressions within 2D plots.
- The possibility to use a locally installed LaTeX compiler for rendering mathematical expressions as raster images, which in turn can be embedded
in 2D plots, was also implemented.
- Last but not least, tables and matrices can also be exported to TeX.
Working with worksheets is much easier now:
- Several menu items and toolbar buttons for column/row operations in tables were added.
- It is possible to export tables and matrices to HTML.
- Two new table to matrix conversion methods: "Regular XYZ" and "2D binning" were implemented.
- It is now possible to sort tables with respect to a text column.
- A bug affecting the recalculation of depended column values was fixed.
This release brings several improvements to the scripting interface:
- Added support for easy access to R from QtiPlot, via the Python scripting engine and rpy2, thanks to Jonas B梨꼑r.
- Several gliches were fixed in the Python syntax highlighter.
- Added a console option (-c) allowing to launch the scripting window as a standalone application, with the possibility
to switch back to the complete workspace interface.
- Fixed possible crashes when calling GSL special functions via muParser.
On a general side:
- Now it is possible to export all QtiPlot subwindows to the open document format (ODF).
- A print preview dialog was added.
- It is possible to import PCM WAV files.
- A new page was added to the Preferences dialog allowing to configure internet connections via a proxy.
- Curve fitting for user defined functions with poles was also improved.
- QtiPlot is now also available in Czech thanks to Pavel Fric.
2009/06/22 - QtiPlot 0.9.7.8 released. Special thanks to Olivier Dubreuil for his bug reports and suggestions.
Changes:
- Slightly modified the Qwt 5.2 library in order to allow painting of 2D curves using floating point coordinates,
resulting in a more accurate/smoother represantation of the data (the modified source code of this library is shipped
with the QtiPlot archive in the "3rdparty/qwt" folder).
- Implemented waterfall plots.
- Added a powerfull exploration tool for 2D plots combining panning and continuous zooming.
- Improved the export of 2D plots to the EMF format on Windows. Now when you copy a plot window or a layer, the images are stored to the clipboard as metafiles using EmfEngine.
- Improved contour line plots. Now the user has the possibility to:
- use the formula defined for the data source matrix in order to calculate Z values, resulting in smoother contour lines
- display text labels for the Z contour levels
- define custom Z levels
- define custom colors and pen widths for each Z level
- Improved Python scripting for 2D curves. Added scripting support for:
- image/contour line plots (spectrograms)
- histograms
- waterfall plots
- Fixed crash when calling newNote() in a Python script with Python 2.6 (thanks to Knut Franke).
- Improved color handling for curves/symbols in a 2D plot:
- the user can define custom colors.
- it is straightforward to restrict all colors to a gray scale or to
define indexed colors via the "Palette" plot layer context menu (Feature Request #00381).
- Improved data fitting capabilities:
- fixed fitting with user defined functions containing removable singularities.
- improved display range of prediction and confidence bands.
- implemented Feature Request #004587: "Fit through zero".
- added planck_wavelength fit plugin, thanks to Knut Franke.
- Improved the display of analytic 2D functions: in case of logarithmic x-scales the values are calculated using equidistant data points on the log scale.
- Improved 2D plot layers context menu.
- Fixed file saving for filenames containing dot signes.
- Added Chinese translation thanks to Fox (Chen Zhang).
2009/04/24
2009/04/22
- Released EmfEngine 0.3.
- Upgraded the Windows binnaries in order to take advantage of the last changes in
EmfEngine 0.3.
2009/04/13
- Released EmfEngine 0.2.
- Upgraded the Windows binnaries in order to take advantage of the last changes in
EmfEngine 0.2.
2009/04/10 - QtiPlot 0.9.7.7 released. This is a Windows dedicated release. Changes:
- Implemented the export of 2D plots to the Enhanced MetaFile format (EMF) on Windows
using EmfEngine.
- Fixed a bug affecting the restoring of maximized 2D plot windows.
2009/04/03 - QtiPlot 0.9.7.6 released. Changes:
- Improved the Python scripting interface.
- Improved debugging in Python scripts: in case of an error, the error line is highlighted
and the error messages are redirected to the scripting console bar.
- Improved export of 2D plots in high resolution. Implemented scaling of plot fonts at export time.
- Improved direct text editing in 2D plots and changed the legend substitution parser to accept Origin like syntax (thanks to Michael Roemer).
- Fixed bug affecting linear fits on non sorted data with error values.
- Small improvements to the import of Origin 7.5 files.
2009/03/10 - QtiPlot 0.9.7.5 released. Changes:
- Improved export options for 2D and 3D plots: now you can specify a custom resolution and print size using either the
user interface or the Python scripting API.
- Implemented the possibility to add user defined menus.
- Fixed issues when exporting to SVG format. Now QtiPlot uses Qwt version 5.2 from SVN
(shipped with the QtiPlot sources in order to simplify the compilation process).
- Added engineering notation to 2D plot scales (thanks to Bartosz Mindur).
- Implemented stem-and-leaf plots (inspired by Python code written by Knut Franke).
- Improved the Python scripting interface (thanks to Michael Roemer):
- added function to adjust decimal separators of imported ascii files
- added function to delete a colum of a table
- fixed compilation issues with Python 2.6
- fixed compilation with Python scripting support disabled
- Improved import of Origin 7.5 projects (thanks to Alex Kargovsky):
- added import of contour plots
- fixed import of matrix color maps
- Improved table statistics: fixed column type settings and added calculation of median value.
- Improved the behavior of 2D plot tools.
- Improved the preferences dialog: now it is possible to specify which axes will be displayed in new 2D plot layers.
- Fixed preview curve in fit wizard.
- Fixed error values reported for built-in exponential fits.
- Fixed platform specific issues on Mac OS X affecting 3D plots.
- Fixed a few other minor bugs.
- Added a Romanian translation.
2008/11/27 - QtiPlot 0.9.7.4 released. Changes:
- Improved table statistics: added calculation of the standard error.
- Differentiation can be now performed directly on a selection of table columns.
- Added import of 3D plots from Origin 7.5 project files. The following plot types are supported:
- scatter plots
- trajectory plots
- bar plots
- wire frame plots
- color fill surface plots
- color map surface plots
- Now range selector tool remembers last selection.
- Improved 2D plot axes dialog: now it is possible to customize all axes in all plot layers with a single click.
- Improved the color map editor.
- Fixed bug affecting saving/restoring of histograms.
- Fixed a few other minor bugs.
2008/10/23 - QtiPlot 0.9.7.3 released. This is mainly a bug fixing release, but it adds some nice features:
- Created a libqti module that could be used as a stand-alone library.
- Improved 3D plots:
- added the posibility to define complex custom data color maps
- added a preview dialog for external color map files (.map)
- improved export to vector formats
- added support for exporting to PGF/LaTeX files, allowing to display texts with subscripts/superscripts
- improved 3D bar plots: you can now choose to draw the mesh and/or the color filling
- a slightly modified version of the QwtPlot3D library is now distributed with QtiPlot
- Improved note editors:
- added Python syntax highlighting
- added support for searching and replacing text
- fixed undo/redo operations
- improved import/export of external files: the file path is now remembered
- Improved the import of Origin 7.5 project files.
- Fixed bugs concerning error bars handling.
- Fixed bug #014598 affecting fitting with constant parameters via the Fit Wizard.
- Fixed bug #014604 affecting the modification of 2D plot texts via their properties dialog.
- Fixed a few other minor bugs.
2008/09/25 - QtiPlot 0.9.7.2 released. This is mainly a bug fixing release, but it adds some nice features:
- Improved fit wizard: the parameters of user defined functions are automatically detected and synthax errors are reported.
Added a new weighting method: Direct Weighting.
- Added a new ellipse tool for 2D plots.
- Implemented the possibility to configure the behavior of note editors with respect to fonts and TAB length.
- Improved autocompletion in note windows.
- Improved Python scripting support:
- added support for rectangles and ellipses on 2D plots.
- added the possibility to customize plot curves in terms of color, line width and line style.
- nonlinear curve fitting is now easier to perform than ever: the list of parameters is automatically detected when you set a fit formula.
- added a launch option (-X) allowing to execute scripts without displaying the user interface.
- Improved export to vector formats with custom resolution.
- Improved Tex equation editor dialog.
- Improved the import of Origin 7.5 project files.
- Fixed bug affecting linear regressions on weighted data sets (#14277).
- Fixed scaling of texts when resizing a 2D plot.
- Fixed matrix data import.
- Fixed a few other minor bugs.
2008/07/22 - QtiPlot 0.9.7 released. New features:
- Better support for images drag and drop.
- Added a new rectangle tool for 2D plots.
- Implemented rotation for texts on 2D plots.
- Added the possibility to display Tex content as an image based on a network service.
- Texts, images, rectangles can now be placed everywhere in the plot window.
- Added a frequency counter tool.
- Added support for arbitrary units when setting the geometry of a plot layer/window.
- Improved all 2D plot dialogs: with a single click you can customize all the plot layers in a project.
- Improved export of 2D plots.
- Many other improvements and bug fixes.
2008/05/19 - QtiPlot 0.9.6.2 released. Bug fixing release:
- Fixed bugs in Python scripting engine.
- Fixed bug in importing images to matrix and in matrix size dialog.
- Fixed Numerical format tab in the preferences dialog.
- Fixed positioning of the legend in 2D plots.
- Improvements to the ASCII import dialog.
- Improvements to tables auto-update values mechanism: when a column expression contains
the column name the values are not updated.
2008/05/14 - QtiPlot 0.9.6 released. New features:
- Implemented autocompletion for script editors and the possibility to display line numbers.
- Implemented confidence and prediction bands for fits. Improved the goodness of fit statistics.
- Improved the Fit Wizard.
- Improved the preferences dialog: added the possibility to customize the background of 2D plots.
- Added integration and linear regression from multiple table column selection.
- Fixed opening of Origin 7.5 files.
- Improved Python scripting engine.
- Fixed bugs concerning error bars.
- Fixed a few other minor bugs.
2008/04/10 - QtiPlot 0.9.5 released. It is based on a slightly modified version of Qwt-5.1 from SVN.
This Qwt version is shipped with the QtiPlot sources for your convenience. Other important changes:
- Implemented automatic column values recalculation in tables.
- Improved the behavior of the Fit Wizard. Added a new built-in linear fit without the constant term.
- Improvements to the multilayer plots and to the Python script interface.
Now you can create a 3x2 grid of 2D plots with a single line of code: newGraph("Title", 6, 3, 2).
- Fixed crash when importing ASCII to matrices.
- Fixed copy/paste in tables.
- Fixed a few other minor bugs.
2008/03/27 - QtiPlot 0.9.4 released. It is based on a slightly modified version of Qwt-5.1 from SVN.
This Qwt version is shipped with the QtiPlot sources for your convenience. Other important changes:
- Improved export of 2D plots: no more white gaps between the axes.
- Highly improved the speed of Table/Matrix values calculation when using muParser as script engine:
QtiPlot is now five times faster then Origin 7.5 when working with matrices.
- Fixed the numerical integration of data sets and added the possibility to integrate analytical functions.
- Added 2D numerical integration for matrices.
- Improved matrix undo/redo framework and fixed all possible memory overflows when working with matrices.
- Improved the custom actions dialog.
- Fixed a few minor bugs.
2008/03/03 - QtiPlot 0.9.3 final stable release. Changes:
- Added support for Undo/Redo when working with matrices.
- Implemented ASCII import/export for matrices.
- Improved matrix to table conversion.
- Added the possibility to hide/show table columns.
- Added support for plotting combined date and time data.
- Improved import of Origin 7.5 project files.
- Fixed a few minor bugs in the Fit Wizard and some other minor bugs.
2008/02/18 - QtiPlot 0.9.3-rc3 released. This is the last release candidate for version 0.9.3. New features:
- Added support for axes breaks in 2D plots.
- Rewritten pie plots in an Origin like way.
Added support for 3D pie plots.
- Added support for drawing with floating point pen width.
- Improved import of Origin 7.5 project files.
- Fixed handling of project folders.
- Lots of bug fixes and improvements to the user interface.
2007/12/18 - QtiPlot 0.9.3-rc2 released
- Added the possibility to store the log information resulting from the analysis operations to different project folders, like in Origin.
- Improved handling of project folders.
- Fixed a critical bug concerning saving of project folders which appear collapsed in the project explorer.
2007/12/16 - QtiPlot 0.9.3-rc1 released
- Added the possibility to define text labels to be plotted for each data point.
- Lots of bug fixes.
2007/11/29 - QtiPlot 0.9.2 released
- Python scripts can now be executed from the different menus and toolbars in QtiPlot.
You can fully customize the new actions (description, icon, shortcut, tool tip)
via a user-friendly dialog.
- The 2D plot legends can now be placed everywhere inside the plot layer.
- Implemented in-line text editing for 2D plot texts.
- Added a format tool bar for all operations concerning 2D plot texts.
- Fixed the behavior of the Import ASCII dialog.
- Fixed bugs in the Fit Wizard and some other minor bugs.
2007/11/14 - QtiPlot 0.9.1 released
Major changes and new features:
- The behaviour of matrices is now completely Origin like: dual image/data view mode,
support for flipping and rotating images, 2D histograms and the possibility to save matrices as bitmap or vector image files.
Fast Fourier Transformations for matrices was also implemented. This is a restricted module (the code is not GPL) and is
available only to users having subscribed for a QtiPlot binaries maintenance contract.
- The fit wizard was higly improved: all the fit models and the initial guesses for the fit parameters
can be saved to XML files, added the possibility to restrict the search range for the fit parameters and
added a preview functionality for the fit models, allowing to determine efficiently the initial fit values.
- Added support for 3D parametric surfaces.
- Added a preview option to the import ASCII dialog and the possibility to import new data as read-only columns.
- Improved the handling of tool bars and added a new tool bar for table column operations.
- The import of Origin 7.5 project files was improved thanks to Alex Kargovsky.
- Fixed export to vector formats on Mac OS X.
2007/09/20 - QtiPlot 0.9 stable release
Changes/new features:
- QtiPlot is now fully scriptable via Python. All objects and data analysis tools available in QtiPlot can be accessed and
customized via scripts. The full description of the scripting interface is given in the updated user manual.
- The import of Origin 7.5 project files was highly improved thanks to Alex Kargovsky.
- The behaviour of the 2D plot grids is now completely Origin-like.
- Added a new logistical fit tool and improved the sigmoidal fit tool.
- Lots of user-requested features were implemented and a lot of bugs were fixed.
2007/07/12 - QtiPlot 0.9.0-rc3 release candidate 3
Changes/new features:
- Improved handling of decimal separators.
- Improved 3D plotting.
- Improved import of Origin 7.5 files.
- Lots of bug fixes and improvements.
2007/05/22 - QtiPlot 0.9.0-rc2 release candidate 2
Changes/new features:
- Decimal separators are customizable.
- Table headers can display comments.
- Better support for Date/Time data.
- Improved printing and export of 2D plots to PDF, EPS and PS vector formats.
- Full import of Origin 7.5 project files.
- Improved/redesigned several dialogs.
- Lots of bug fixes and improvements.
2007/04/17 - QtiPlot 0.9.0-rc1 release candidate 1
Changes/new features:
- Complete port from Qt 3 to Qt 4.2
- Python scripting is now also available on Windows systems
- Added support for antialiasing
- Better support for transparency in 2D plots
- Easy PDF export
- It is now possible to plot only a partial row range of a data column
- Many more symbols for text labels (h-bar, infinity, ...)
- Improved import of Origin 7.5 files, including tables, matrices and graphs (experimental), thanks to Alex Kargovsky (the improved version of liborigin is shipped with the QtiPlot sources)
- Lots of bug fixes and improvements
22/01/07 - 0.8.9:
- Improved the manual and changed the help system in order to use the powerful QAssistant (it must be placed in the same folder as the qtiplot executable).
- Upgraded to the unofficially released yet version muParser 1.28 which fixes crashes on 64bit machines when working with 3D surface plots.
- Upgraded to the last release of liborigin (liborigin-20070115).
- Added a toolbar for matrix plots.
- Added several toolbuttons to the 3D plots toolbar.
- Improved the automatical layout of 3D plots and fixed a bug in changing the Z scale limits.
- Added the possibility to set the values of a matrix using the x and y parameters as in Origin.
- Added the possibility to use "-" in column and window names.
- Added handy shortcuts for import ASCII operations.
- Fixed bugs in image and contour plots.
- A lot of other bugfixes.
24/11/06 - 0.8.9-rc2: A lot of bugfixes and improvements.
31/10/06 - 0.8.9-rc1:
- Implemented Spectrogram and Contour plots.
- Fixes bugs in drawing of error bars and a crash occuring when plotting X,Y,Yerr data sets with Vertical/Horizontal Bars style.
- Saves the path to the last visited folder used for importing/exporting ASCII files and for loading images as different locations from the last visited project files folder.
- Enforces the checks regarding the minimum number of points needed by GSL to perform a fitting operation, thus eliminating crashes.
03/10/06 - 0.8.8: New features:
- Improved the 3D plotting
capabilities by adding the possibility to use color map files (example colormaps
the choice between orthogonal and perspective modes and the possibility to animate the 3D plots.
- Added the possibility to attach the grid and the 2D plot curves to different axes. The oposite axes may now display different scales.
- Upgraded to Qwt5.0.0-rc0, which fixes misalignment between in and out ticks in 2D plots.
- Fixed saving/restoring of 2D plot markers to/from project files.
- Fixed bugs when drawing Spline curves.
- Added a VerticalSteps plot style.
-Added an Origin-like feature: when plotting a list of columns, if some
columns are declared as having yErr or xErr type, they are plotted as
error bars.
- Dropped support for project files with version lower than 0.6.4: in
order to open project files older than this version please use
QtiPlot-0.8.7
- Fixed bug in NonLinearFit class: setting only one parameter caused
crashes.
- Improved the TableStatistics behavior: they now react to columns being
deleted or renamed in the base table and the
user can use them directly for plotting.
10/09/06 - 0.8.7-3: Bug fixing release:
- Fixed inward ticks drawing in 2D plots.
- Fixed export to EPS in 2D plots.
- Fixed crash occuring when adding new curves to 2D plots
having the global user option "Autoscale axes" disabled.
- Column / Row statistics tables are from now on automatically updated
when the base table is edited.
- Added support for folders to Python interface.
- Added a user global option allowing to scale fit errors with
sqrt(chi^2/DoF) .
- Fixed some bugs in the translation of the Preferences dialog and the
translation of the Python Script Window when the language of the main
application is changed by the user.
- Upgraded French and Spanish translations.
07/09/06 - 0.8.7-2:Bug fixing release:
- Fixed a crash occuring when trying to open and plot an ASCII file via
the command line.
- Changed the behavior of
the insert colun operation: from now on the new column is inserted
before the selected column (Origin-like behavior).
- Fixed handling of the initialization file for Python scripts (thanks
to Knut).
04/09/06 - 0.8.7:
- Added support for evaluating mathematical expressions and executing scripts
using the Python interpreter on Linux and Mac OS X. Scripts can be
edited and executed via Note windows or using a script window (which
can be
launched via a handy shortcut: F3). As soon as the port to
Qt4 is ready, these features will be also available on Windows.
-Completely rewritten all fit routines in order to make them
available to the scripting interface. Now fit
routines
support weighting and their output is highly
customizable: the user may choose to define the resulting fit
curves as mathematical expressions (normal functions) or via a
data set.
-Improved the Non-linear Fit dialog.
-Improved the Help Browser. A much improved version of the manual is now available online (thanks to Roger Gadiou).
-Fixed bugs causing crashes during Multi-Peak Fits and other analysis operations.
-Improved saving and restoring of user global settings, including saving of ASCII import options.
-Fixed crash occuring when deleting multiple table rows.
-Improved behaviour of column/row headers in tables/matrices.
-Added new symbols to 2D plot curves.
-Added an Origin-like title bar menu for the MDI windows.
02/08/06 0.8.6 - 2: Bug fixing release:
- Fixes a nasty bug in the export of 2D plots, causing the exported
image files to display an empty white rectangle.
- Fixes compilation on 64bit linux systems (patch submitted by Mohamad
Al-Saqer).
- Improves automatic search for updates.
30/07/06 0.8.6: New features:
- Modified the build procedure: liborigin will no longer be shipped with QtiPlot.
- Ported to Qwt5 (last version from CVS).
- Added a scripting interface (thanks to Knut Franke). The current
implementation of the interface is very limited, only calculation of
math expressions with user defined variables is supported for the
moment. Setting values in table/matrix and the note windows support
execution/evaluation of script code.
- Added the possibility to export 2D plots to .SVG format.
- Added a tool button for drawing lines and added the possibility to
resize lines/arrows using the mouse.
- Improved the Line/Arrow Dialog: the coordinates of the line ends can
be now displayed/edited in pixels or in scale coordinates.
- Added the possibility to set and store default parameters used when
drawing arrows/lines and texts on 2D plots.
- Added a zoom out tool button for 2D plots and modified the keybord
short-cuts for zooming in/out.
- Added the possibility to change the canvas background color for 2D
plots. - Improves the drawing of 2D plots grid.
- Modified the behaviour of axes ticks in 2D plots in order to get an
Origin like behaviour.
- Improved the help browser: it can be used as a stand-alone
application and can be launched via the command line: qtiplot
-h(--help).
- The error messages rising from wrong command line options are from
now on translated accordingly to the users's locale settings.
- Improved the preferences dialog and added a search for updates on
start-up option.
- Added a FunctionCurve class for better handling of this type of 2D
curves. - Added the possibility to move the error bars attached to a
BarCurve having a non-zero offset together with the bars.
- Added the possibility to specify X/Y Error columns in tables.
- Added the possibility to resize the width of columns in tables using
the mouse. A double-click on the header section handle auto-adjusts the
column width.
23/05/06 0.8.5: New features:
- ported to the last version of liborigin: the import of Origin
projects (tables only) works on Linux and Windows systems
- fixed compile errors on Mac OS X 10.4
- added the possibility to move rows in tables/matrices (press 'Ctrl'
and drag row)
- pasting numbers into Table/Matrix cells respects the numeric format
- improved the error bars dialog and the greek symbols dialog
- fixed bug affecting the creation of new folders on Linux systems and
some other minor bugs
17/05/06 0.8.4: New features:
- improved the project explorer: added support for folders
- improved the layers layout management in 2D plots and the
corresponding arrange layers dialog
- improved the user interaction with the layers via mouse: resize and
move operations have been optimized
- improved the 2D plots axes dialog and the polynomial fit dialog.
- fixed a bug affecting the reload of Box Plots from project files
(reported by Mark Engle) and some other minor bugs.
16/04/06 0.8.3: New features:
- added Vectors XYAngleMagnitude plots
- added Note windows useful for saving comments in the project files
- added the possibility to compress the project files to the .gz format
using the zlib 1.2.3 library
- from now on the project files are backuped before saving in order to
prevent any data losses (thanks to Knut Franke).
- improved data analysis: added a built-in Boltzmann (Sigmoidal) fit
function.
Fixed several minor bugs.
16/03/06 0.8.2: New features:
- added templates support: all the settings for plots (2D/3D), tables
and matrixes can be saved to ASCII files and restored later on,
resulting in faster editing process
- added a simplex fit algorithm (many thanks to Aaron Van Tassle)
- improved the behaviour of Matrix objects: from now on you can specify
x and y coordinates to be used when creating a 3D plot from a matrix
- improved the Import/Export ASCII dialogs.
- fixed problems on Mac OSX 10.4
- fixed several bugs and added some small features reported/suggested
by Roger Gadiou.
- the almost complete Spanish translation was added to the binary
packages (thanks to Jose Antonio Lorenzo Fernandez).
The QwtPlot3D library is no longer shipped with QtiPlot. Please
download and install it before you try to compile QtiPlot.
16/03/06 0.8.1: New features:
- added the possibility to switch the language at run-time (French and
German translations were added to the binary packages);
- ported to the last unofficial version of muParser (v 1.26) which
fixes precedence problems due to the ^ operator: -1^2 is now correctly
evaluated to -1 and not to 1 as before;
- improved the Help menu;
Fixed several bugs.
06/03/06 0.8: New features:
- multi-peak fitting with Gaussian and Lorentzian profiles;
- improved the non-linear fitting dialog: added the posibility to fix
parameters as constants during fitting with user-defined functions and
added the possibility to delete the fit curves from the dialog;
- in all the dialogs giving the posibility to choose the analysis
interval, the x data range can from now on be changed using the data
range tool (menu "Data|Select data range");
Fixed several bugs.
28/02/06 0.7.9: New features:
- added support for statistical Box/Whiskers diagramms;
- the project files are no longer automatically saved after opening
resulting in increased speed;
- changed several icons;
Fixed bugs in non-linear fitting dialog. Fixed several bugs concerning
table operations.
14/02/06 0.7.8: New features:
- added the posibility to automatically translate 2D curves;
- added the posibility to define multiple X columns in a table;
- improved the tables menu;
- improved the file dialogs: the last location is remembered;
- improved the 2D plot dialog and the Column options dialog;
- modified the Qwt library in order to synchronize Left/Right and
Top/Bottom scales (use the modified version provided in the QtiPlot
archive);
-added the possibility to specify the color of the result curve after a
non-linear fit operation.
Fixed bugs in non-linear fitting with user defined functions. Fixed
several minor bugs.
24/01/06 0.7.7: New features:
- improved data analysis by adding: convolution/deconvolution,
correlation, FFT from tables;
- improved the behaviour of the main menu;
- improved the bar plots: the bars can be drawn next to each other when
plotting several bar curves having the same x values, by setting an
offset;
- added the possibility to enable/disable the autoscaling of fonts and
the resizing of 2D layers in the "Preferences|Plots 2D" dialog;
- added the posibility to draw smooth mesh lines in 3D plots (this can
be disabled using the "Preferences|Plots 3D" dialog);
Fixed several bugs in the 2D plots.
16/01/06 0.7.6: New features:
- improved data analysis by adding: smoothing (Savitzky-Golay, FFT,
Moving Window Average), FFT filtering (low/high/band pass and band
block filters);
- completely rewritten the FFT code;
- changed the behaviour of the Top and Right axes in 2D plots: they are
now synchronized with the Bottom/Left axes respectively;
- added the possibility to change the axes labels by specifying a
non-linear function with respect to the labels of the opposite axis;
- enabled the editing of the 3D Surface plots;
Fixed several bugs in the 2D plots dialog and in the 3D plots.
20/12/05 0.7.5: New features:
- added the possibility to import several ASCII files into the same
table (as new rows or as new columns);
- added the possibility to edit plotted function curves;
- enabled .eps export on Windows (if a PS printer is available);
- added an EPS export dialog;
Fixed several minor bugs.
13/12/05 0.7.4: New features:
- added the possibility to use fit functions plugins, which are faster
and more reliable then using the muParser in order to calculate the
jacobian matrix (take a look at the "fitPlugins folder" for two
examples of how to create and compile a plugin);
- added the possibility to move the selected lines and texts on a 2D
plot using the arrow keys;
- added context menus for the axes, the axes labels and the title of a
2D plot (right click on these objects in order to open the menu);
- added a progress dialog when importing ASCII files and redesigned the
import method in order to maximize the speed;
Fixed bugs linked to the hidden tables generated by the fitting
operations. Completely rewritten the built-in fitting routines.
25/11/05 0.7.3: New features:
- improved the behaviour of the Project Explorer and of the Result Log
tools using dock windows;
- added the possibility to disable the autoscaling in 2D plots;
- added drag-and-drop support for opening ASCII, image and project
files;
- changed the behaviour of QtiPlot when importing single ASCII files:
if a table window is active, the file is loaded into it, if not a new
table is created;
- tables created as a result of a fit operation are by default hidden;
Fixed bugs in non-linear fit dialog, the exporting of the font sizes to
EPS and
bug in errors reporting after performing a polynomial fit.
Project files with version number lower than 0.4 are not supported any
more in this new release. If you still have some old files left you
must first open them with a lower version of QtiPlot, in order to
convert them.
15/11/05 0.7.2: New features:
- added an interpolation dialog;
- added the possibility to set a label for any window in a project and
an appropiate rename window dialog;
- added the possibility to specify a comment for any column of a table;
- added a plot associations dialog allowing to specify which column is
to be used for the X or Y data in 2D plots;
- improved the behaviour of the main menu;
Bug fixes: fixed bugs concerning error bars and pie plots.
01/11/05 0.7.1: New features:
- import of Origin .opj projects (tables only) using liborigin;
- a colored frame and background can be set for the 2D plots as well as
a margin space;
- added direct access to greek symbols using Unicode;
Improvements:
- scaling of the fonts when resizing the plots;
- improved the import and export ASCII dialogs;
- upgraded to muParser 1.23, fixing problems on amd64.
Bug fixes: fixed choking of columns when importing ASCII files having
columns with different row numbers.
16/10/05 0.7: New features:
- added support for translations;
- matrix objects optimized for drawing 3D height maps;
- easy conversion between spreadsheets and matrixes;
Improvements:
- preferences dialog: added the possibility to customize the default
settings for 3D plots;
- fit dialog: added the possibility to split the fitting function into
several parts and to save each of these sub-functions to a different
name;
- improved the behaviour of the main menu;
- added bindings between the muParser and the following GSL functions:
regular and irregular cylindrical Bessel functions, Gamma and Beta
functions and to some error functions: erf, erfc, hazard function, etc.
Bug fixes: fixed many bugs in 3D plots and bugs linked to date/time
axes in 2D plots.
A
mailing list is now available.
03/10/05 0.6.9: New 2D plot features:
- the linewidth of the axes may be changed;
- the axes are provided with "stand-off" capability;
- the length of the ticks may be customized;
- added time and date support;
- added bounding box information to EPS files generated on MAC OSX;
Improved:
- project files loading (increased speed for very large tables);
- preferences dialog: added many options allowing to customize the 2D
plots default settings;
- ASCII import and export;
New menu items:
- "File | Print All Plots": allows quick print of all 2D plot windows
in a project.
- "Help | Choose help folder": allows to choose the location of the
help files (useful for users having downloaded the manual and/or its
future translations).
11/09/05 0.6.8: Bug fixing release. Fixed:
- crash due to the presence of round brackets in column names;
- crash due to operations on empty 2D plot windows;
- bug in setting column values calculations;
- showing the axis labels for top and right scales;
- showing the other project files in the file dialog when saving a
project;
- printing of multilayer plots;
Added a "File | Export Graph | All" menu allowing to export all the
plot windows in a project to a chosen image file format.
14/08/05 0.6.7: Improved the column values dialog. Fixed bugs linked to top and right axis scales in 2D plots.
08/08/05 0.6.6: Added date and time support in spreadsheets.
Improved the column options dialog: added buttons for easy navigation
through the columns of a spreadsheet.
Fixed bugs linked to spreadsheet resizing in terms of columns and rows.
01/08/05 0.6.5 - 2: Fixes a bug making the legends disapear from the 2D plots.
31/07/05 0.6.5: Please use the Qwt library provided in the
QtiPlot archive.
Fixed bugs affecting spreadsheet operations: ASCII files import,
copy/paste for large data sets. Added an image export dialog, allowing
to specify the image quality and whether the image should be
transparent or not for .png, .xpm and .tif files.
Fixed bug affecting export operation for plot windows not entirely
visible on screen.
23/07/05 0.6.4: Please use the Qwt library provided in the
QtiPlot archive.
Fixed bugs affecting spreadsheet operations: selection of columns in
tables, large ASCII files import (tested on a 1000x1000 file),resizing
after adding columns. Added the possibility to normalize the whole
spreadsheet or only a selection of columns.
Fixed bug afecting legend items on 2D plots. Fixed bug concerning plot
titles and scale labels displayed on several lines. Added scales with
superscript powers of 10. The installation procedure has changed, since
I had to slightly modify the Qwt library in order to implement this new
feature.
02/07/05 0.6.3: Improved the layers layout dialog: from now on the layers are arranged with respect to the area inside the axes. Added
a dialog allowing to specify the initial guesses when performing a first order exponential fit. Fixed bug linked to logarithmique scales
in bar plots. Fixed some other minor bugs.
19/06/05 0.6.2-2: This release fixes bugs in 0.6.2.
14/06/05 0.6.2: This release adds the ability to draw axes with text tick labels. There are some bugfixes.
07/06/05 0.6.1: This release adds vector XYXY plots, the ability to reverse the xBottom and yLeft scales,
and the ability to use the row index when defining the column values
with the following syntax: g(i)*col(name, f(i)), where f and g are
arbitrary functions depending on the row index i. It improves .eps
export for single layers. There are many other bugfixes and improvements.
.tiff images support added to the distributed Linux packages using libTiffIO.
09/05/05 0.6.0: Added the possibility to set a rotation angle for x axis tick labels (top and bottom).
Improved keyboard interaction with multilayer plots: you can naviagte
through the layers using the F12 (forward) and F10 (backward) keys; F11
key shows the plot window context menu; you can select the different
objects of a plot using the Tab key; pressing Enter or Return key when
an object is selected will pop up it's options dialog (no more need to
double click for that). Fixed some bugs.
04/05/05 0.5.9-4: Fixes some bugs. Improves user interaction with 2D plots.
03/05/05 0.5.9-3: Fixes problems with 0.5.9-2. Added customization options for arrow heads.
28/04/05 0.5.9-2: Fixes bugs in 0.5.9 (no more crashes when you set column values or do curve fitting) and
improves the GUI style feature (patch fron Vincent Wagelaar). Hopefully it compiles on amd64 systems (please tell me if I'm wrong).
26/04/05 0.5.9: Horizontal bars plots added. Improved user customization of the application: user can set the
GUI style, the fonts, the colors and the automatically saving time. Added a "Windows| Window Geometry..." menu option, allowing the user to
easily specify the size of a plot window from a pop-up dialog. Many other improvements and bug fixes.
24/03/05 0.5.8-3: No more flickering when moving objects (texts, arrows) on a plot, thanks to Vincent Wagelaar.
23/03/05 0.5.8-2: Fixes a very nasty bug in 0.5.8 making the application crash when doing a plot.
22/03/05 0.5.8: Automatical resizing of the different layers when the plot window is resized. Improved layers
adding and arranging mechanism. Improved 'arrange layers' dialog. Changes to the menu.
18/03/05 0.5.7: Vertical bars plots like in Origin and histograms support added.
Improved 3D plots. Fixed bugs linked to Crosshairs style line width. Improved layers diaolg. Improved menus. Imroved .EPS export: the aspect
ratio of the plots is taken into account from now on. Improved plots printing.
01/03/05 0.5.6: Fixed bug linked to "Delete layer" functionality. Improved copy/paste mechanism: no more crashes when copying a layer from one
multilayer window to another. Added a "Special Line/Symbol" submenu to the "Plots 2D" menu, with three more plotting options: "Vertical Drop Lines", "Spline" and "Vertical steps".
24/02/05 0.5.5-2: Fixed some bugs linked to column insertion in spreadsheets.
23/02/05 0.5.5: Improved versatile spreadsheets: X column, used for 2D plots, and Y column, used in 3D plots, are from now on very easy to identify. Fixed some bugs.
20/02/05 0.5.4: Added a new 3D plotting style: Cones. Improved non-linear curve fitting dialog. Fixed bugs in 'Undo/Redo' functions. Fixed some other bugs.
11/02/05 0.5.3: Improved user interaction with 2D plots: a double-click on axis numbers opens the axis/scale dialog.
Improved import of multiple ASCII files. Added a new 3D plotting style: Cross Hairs. Improved non-linear curve fitting dialog. Fixed some bugs.
17/01/05 0.5.2: Fixed some bugs related to 3D plots. Analysis: added FFT transforms (thanks to Vasilis).
14/01/05 0.5.1: Improved 3D plots dialog, by adding some zooming options (for users not having mouse wheel).
Improved Plot Wizard: from now on you also have the possibility to create 3D plots.
Changed "Format|Set rows" in "Format|Rows and columns": you can change the number of columns from this dialog and you can quickly see which
are the X and Y columns in the table. Added "View|Preferences..." dialog, which allows the user to choose the
default settings for the tables (fonts, colors) and for the 2D plots. You can also custom the prompts on windows closing.
05/01/05 0.5.0: 3D plots using data values from tables. More customizable 3D plots: you can change data colors, line width, points size. Added a
"vertical 3D bars" style (warning: memory consuming!). Fixed some bugs.
19/12/04 0.4.9: From now on you can easily resize layers by pressing the SHIFT button and dragging the mouse (or using the mouse wheel).
Auto-scaling for error bars. Improved zooming. Improved copy/paste operation to and from tables. You can easily select multiple columns for plotting using mouse dragging.
28/11/04 0.4.8 - 2: Added an automatic scale number format (most concise).
27/11/04 0.4.8: In and Out scale ticks. User can define scale numbers format and precision. Multi column sorting available. Fixed bugs on analysis (no more 'log.txt" files created).
21/11/04 0.4.7: Improved inward scale ticks drawing. Fixed analysis bugs, no more crashes (I hope so). Fixed "undo/redo" bugs and a lot of other minor bugs. Improved column names import from ASCII files.
16/11/04 0.4.6: Inward scale ticks. Improved integration (thanks to Vasilis). You can simply add texts outside the plot canvas. Improved printing and EPS export of 2D plots.
14/11/04 0.4.5-2: Fixes bug concerning 2D plots log scales. The data cursor handling, using arrow keys, works again.
13/11/04 0.4.5: Improved printing and .EPS export: no more limitations on the plot canvas frame.
Improved layers copy/paste mechanism: you can copy a layer from one window to another (in the source window right click and choose
'Copy|Active Layer' then in the destination window type 'CTRL+V').
12/11/04 0.4.4: Fixed transparency bugs and transparent layers printing and exporting to .eps bugs.
10/11/04 0.4.3: Transparent layers. Improved layers layout dialog.
Improved 'Set columns value function': no more restrictions on the column names.
Analysis results information saved in the .qti project file instead of
a "log.txt" file (the log info can be cleared using 'Edit|Clear log
informations'). Parametric and polar plots from user defined functions.
07/11/04 0.4.2: Data interpolation available.
Improved ASCII files import (you can ignore a number of lines, and
import labels for the worksheets columns).
Improved error bars dialog: you can plot error bars from existing
columns.
Fixed bugs on analysis and some other minor bugs.
Improved analysis: you can easily choose the curve to analyze from a
dialog box. You can easily modify the number of rows in a worksheet: menu 'Format|Set rows number...'
04/11/04 0.4.1: Fixed analysis bugs in version 0.4.0.
02/11/04: Multilayers 2D plots available.
24/10/04:Fixed bugs concerning quick data range selection using mouse. Improved ASCII files import. Changed the import dialog.
23/10/04: 0.3.9: Quick selection of the active data range using the mouse and improved texts moving on the 2D plots.
20/10/2004: Fixed some nasty bugs on Windows version (3D surface plots work, but
QtiPlot still crashes on exit). Fixed some minor bugs concerning 3D plots windows. Improved fitting (thanks to Vasilis).
18/10/2004: From now on QtiPlot recognizes the pi constant under any of the
following forms: 'Pi','pi' or 'PI'.
Changed the functions available when setting column values: if...then
...else, min and max functions available (using Fast Mathematical
Parser). Changed the behaviour of non-linear curve fit dialog. Improved the layout of some dialogs.
15/10/2004: 0.3.8: Improved the plot objects selection. Replaced the plot information display with a tool bar. Changed the behaviour of the remove data points function.
Fixed some bugs. Added an image analysis tool, allowing to visualize pixel line profiles from image files (see 'help.html' file in the archive for details).
14/10/2004: Improved some dialogs.Fixed some bugs.
12/10/2004: Duplication of 3D surface plots available. Slightly changed toolbars. Fixed some bugs.
11/10/2004: 0.3.7: You can view and insert images into plots. Fixed bug concerning function curves duplication. Improved Copy/Paste mecanism on 2D plots components.
06/10/2004: 0.3.6: 3D Surface Plots available, using the QwtPlot3D library (try 'CTRL-Z' keys). Please read the "instal.html" file for details.
Improved ASCII import: the default "Auto" setting allows to correctly import ASCII files with column delimiters containing non-digit
characters followed by white spaces and tabs.
11/09/2004: Curve fitting with user defined functions available: try 'Analisys' menu -> "Non-linear Curve Fit...'.
01/09/2004: Plotting curves from equation available: try 'Graph' menu -> "Add function curve'.
30/08/2004: Fixed printing and EPS export of pie plots. Improved 'Undo' functionality for table operations.
29/08/2004: Fixed saving of non default widths for table columns. Fixed printing bug on Windows. 'Undo' function available for table operations (it will be
soon available for plot operations).
28/08/2004: Fixed bug concerning the saving of the hidden windows and other minor bugs.
26/08/2004: Fixed printing and EPS export of plot legends. Statistics on columns available.
18/08/2004: Improved printing and EPS export. Fixed bugs concerning scales tick length and plot legend updates.
From now on you can enable or disable the printing of the tick labels of the plot scales.
17/08/2004: Printing and EPS export available for plots with x bottom or y left scales
disabled. You should make a CVS update of the Qwt 4.2.0 library to make
this feature available. Fixed some bugs concerning the colors of the scales titles.
16/08/2004: Improved recent projects browser functionality. Improved plots layout. Fixed some minor bugs.
15/08/2004: Help browser available. Recent projects browser functionality added. Fixed some bugs.
10/08/2004: Fixed some bugs concerning negative data import and curve fitting.
09/08/2004: Polynomial fits, second and third order exponential decay fits available.
07/08/2004: RPM package for Linux Mandrake and Red Hat distributions available.
06/08/2004: Interoperability with OpenOffice and MS Word: you can easily copy/paste
graphics from QtiPlot to OpenOffice Writer or Impress and MS Word. Simply right click in the plot window and choose the 'Copy Graph'
option from the pop-up menu! Copy/paste data text from and to Excel also available.
05/08/2004: EPS format export available for Linux Systems. It only functions if the left and bottom axes of the plot are enabled. Fixed some bugs.
04/08/2004: Added data plot wizard. Press 'CTRL+ALT+W' keys to show it, or go to 'View' menu-> 'Plot wizard'.
03/08/2004: Improved 2D Pie Plots. Fixed some bugs.
02/08/2004: 2D Pie Plots available.
30/07/2004: Windows binary package.
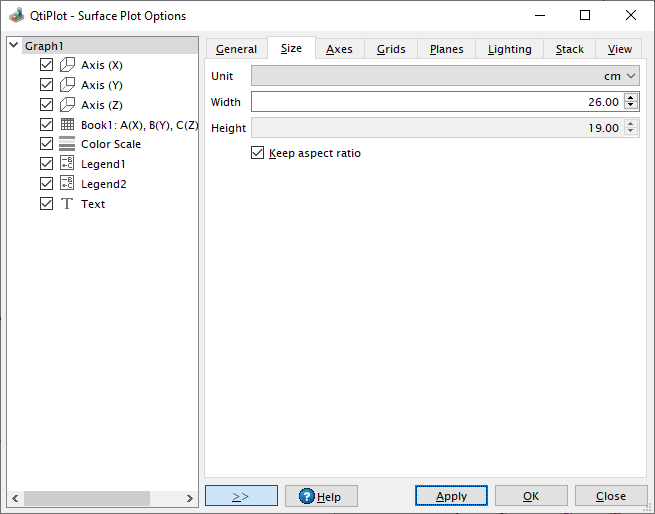
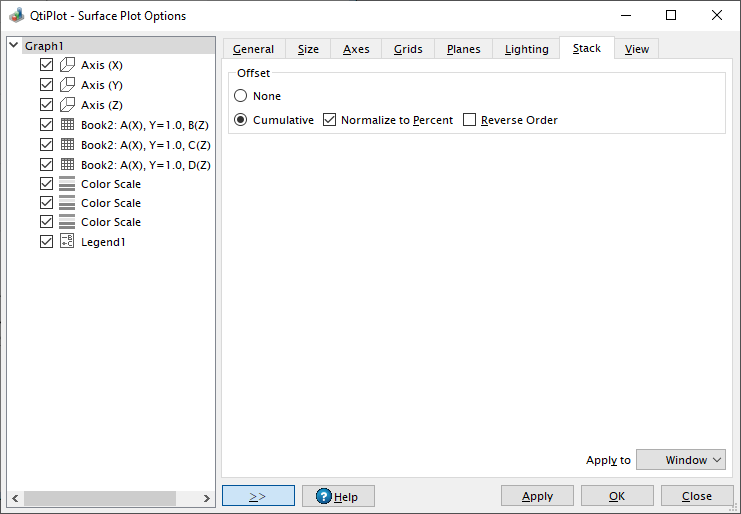
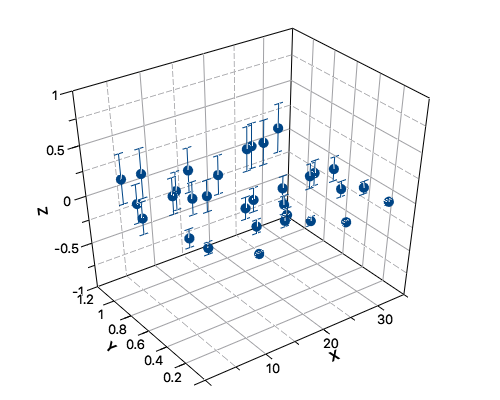
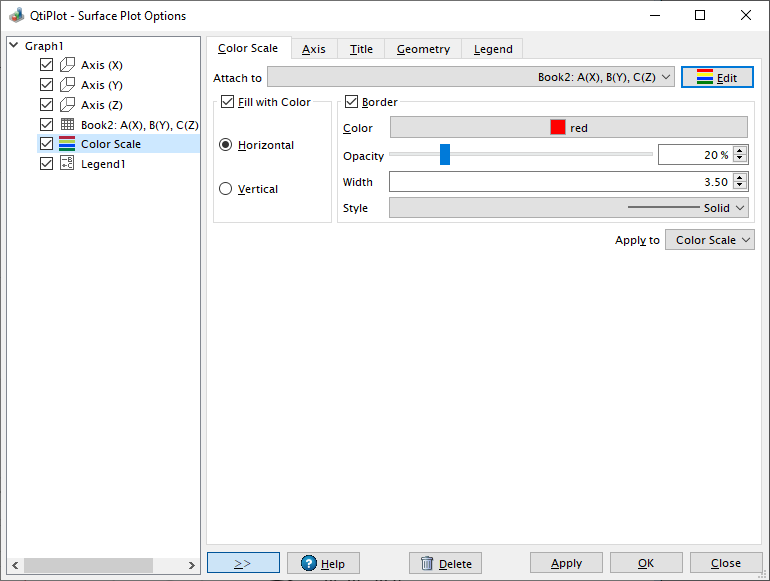
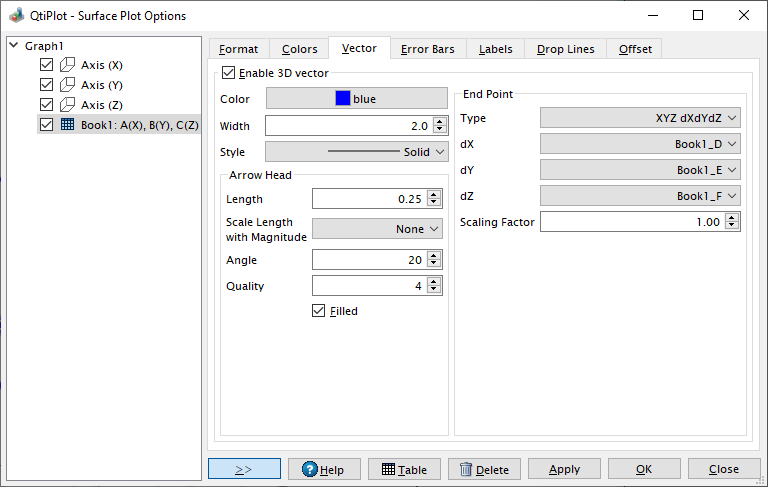
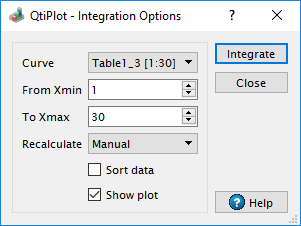
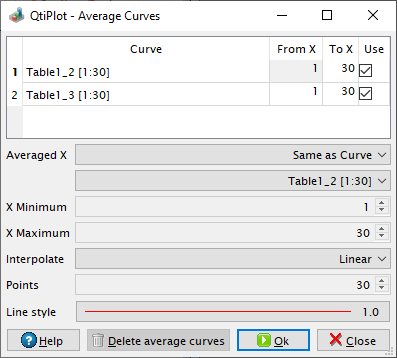
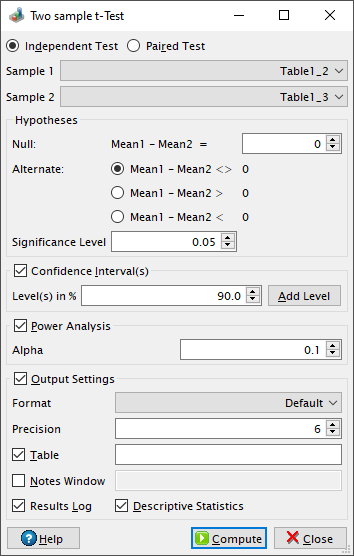
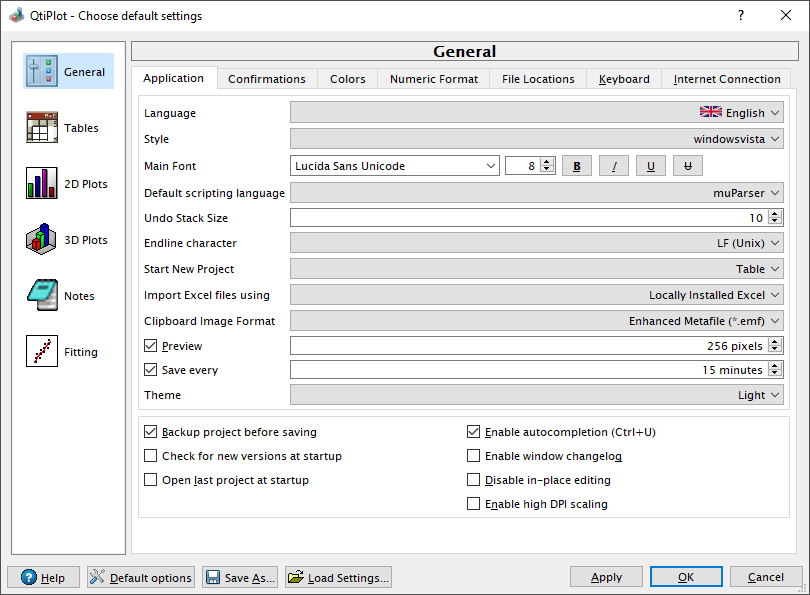
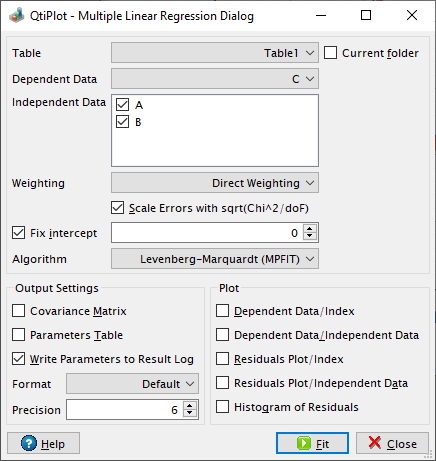
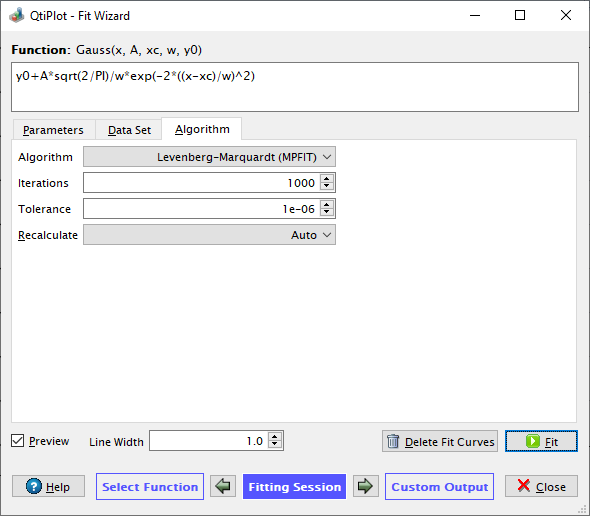
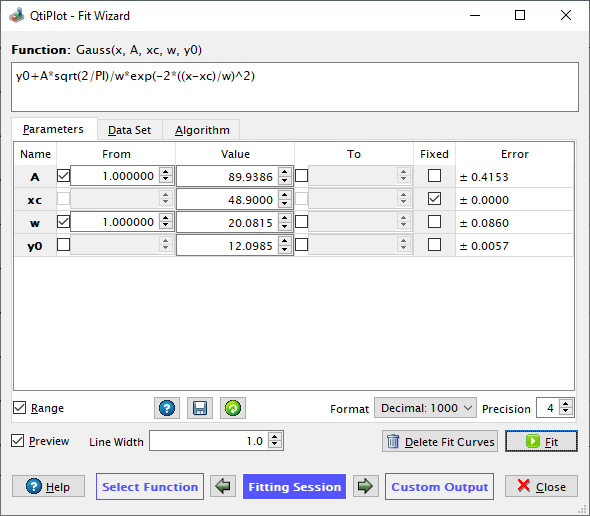
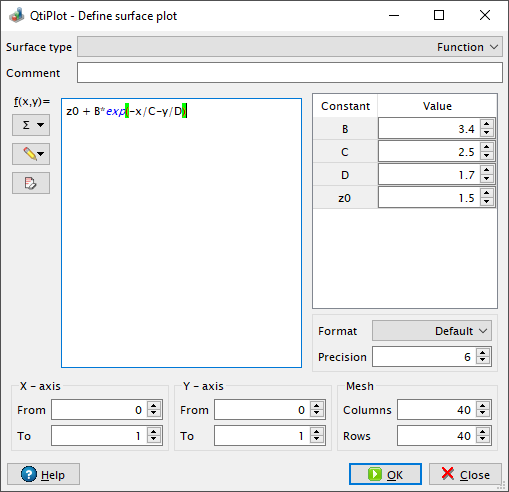
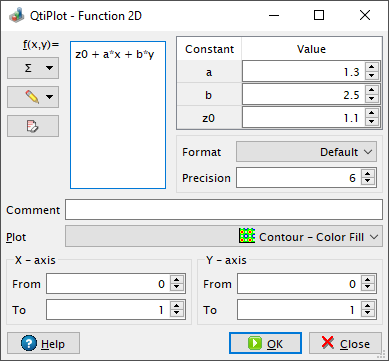
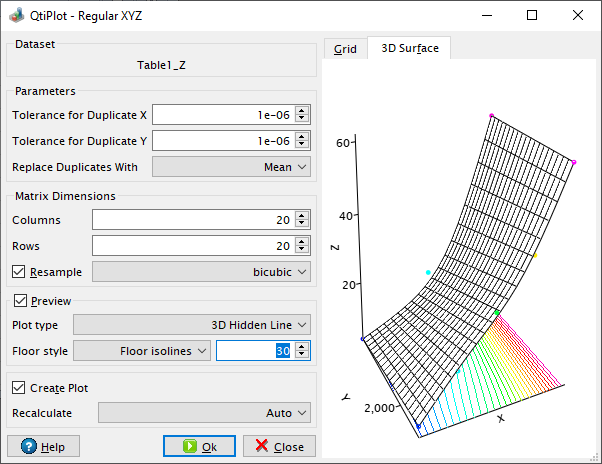
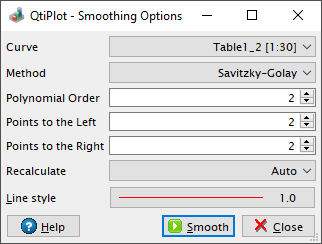
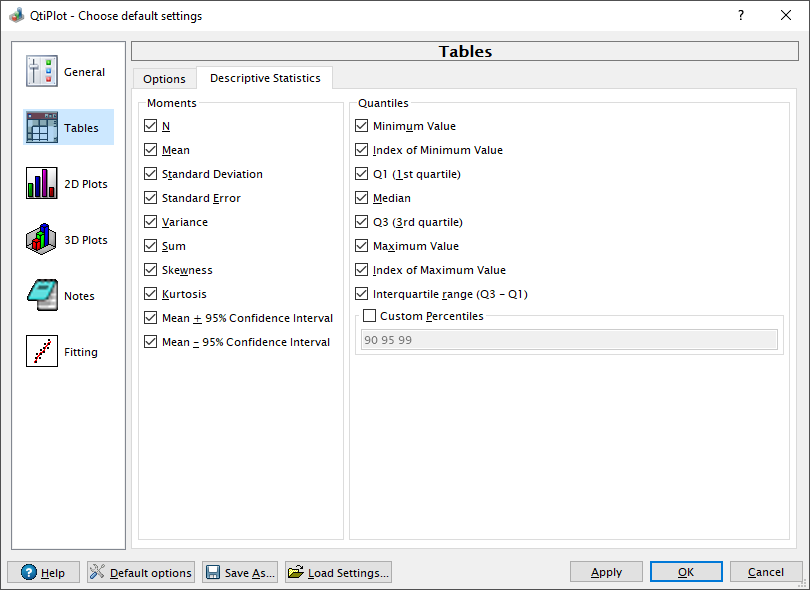
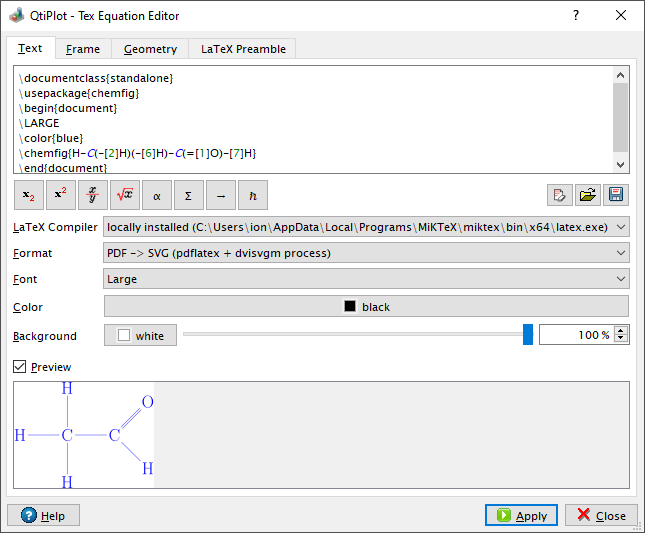
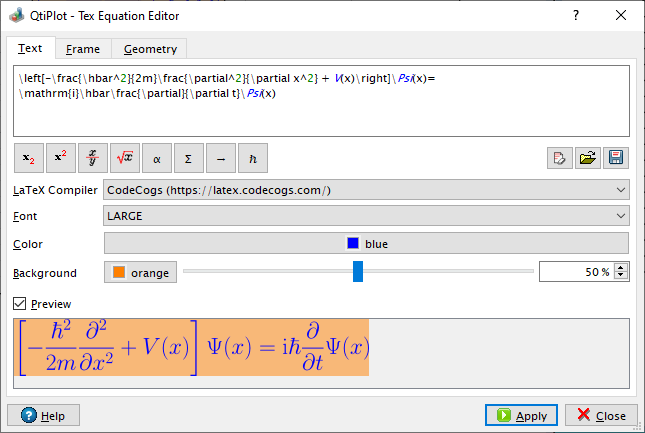
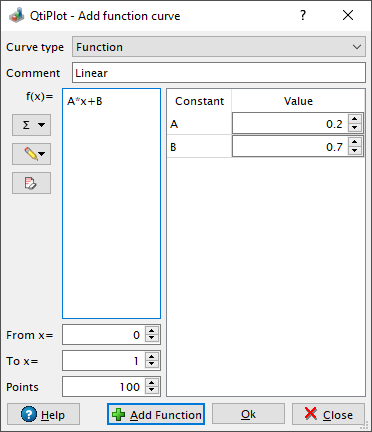
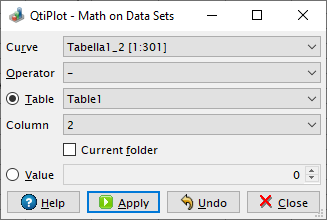
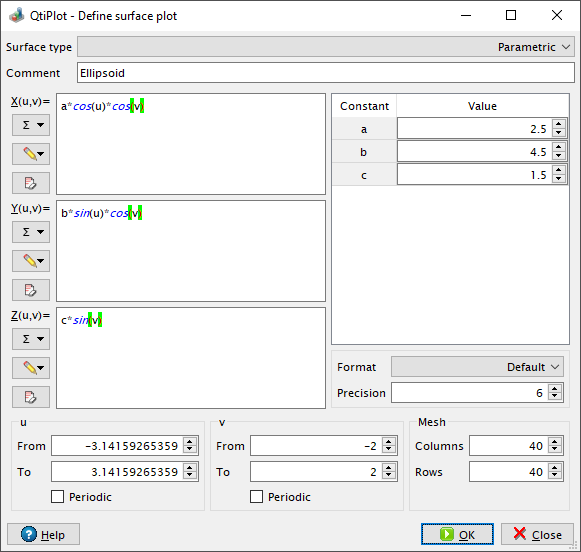
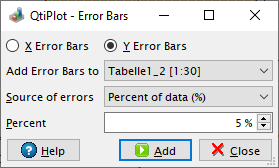
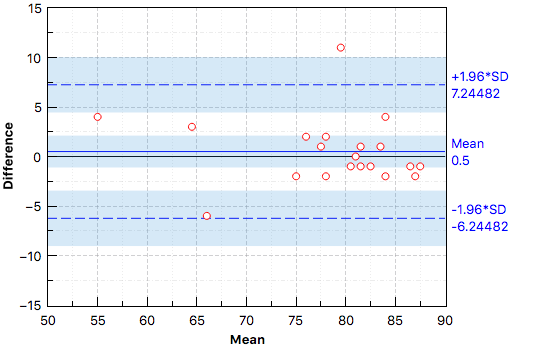
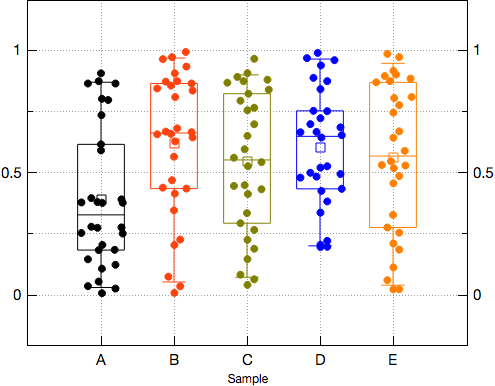
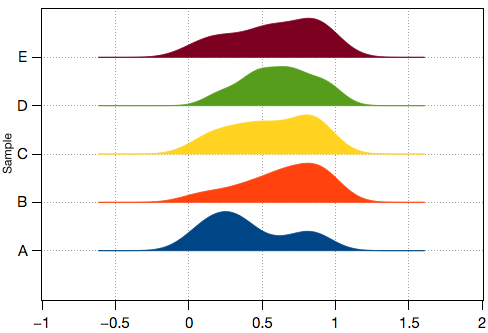
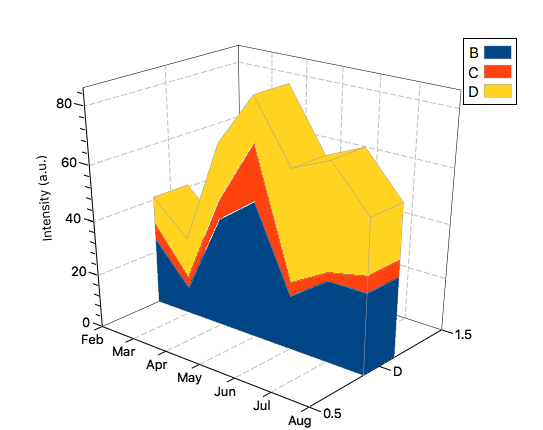
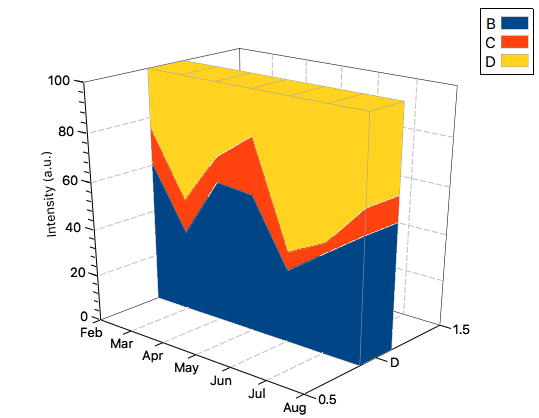
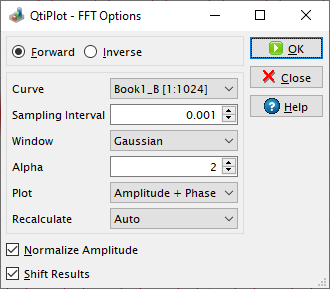
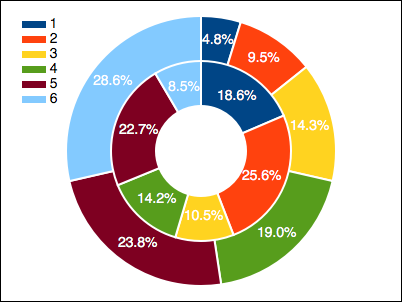
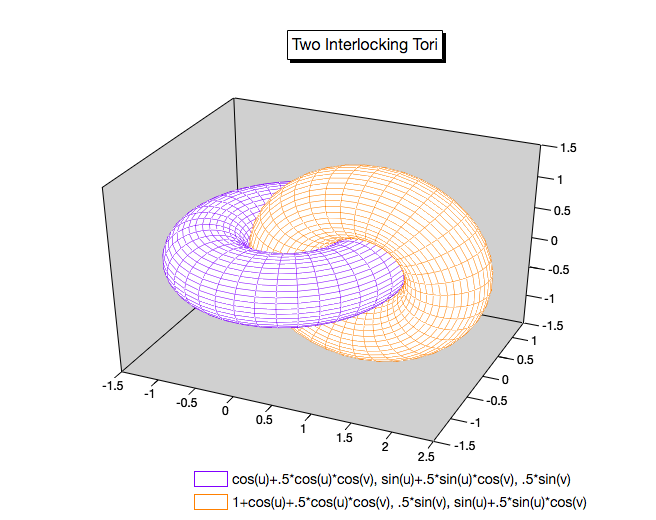
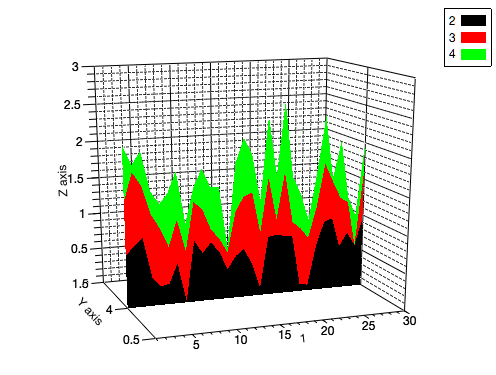
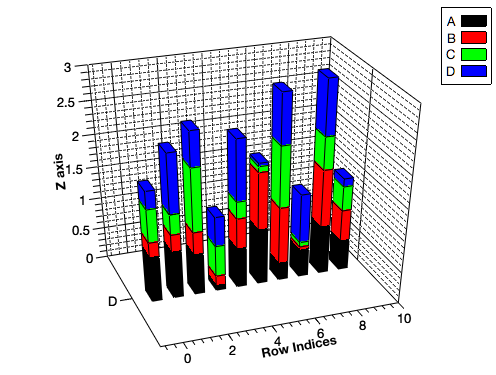
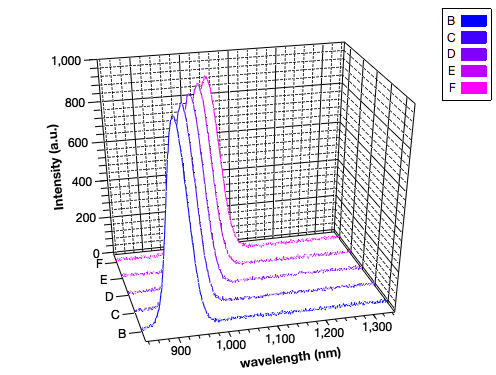
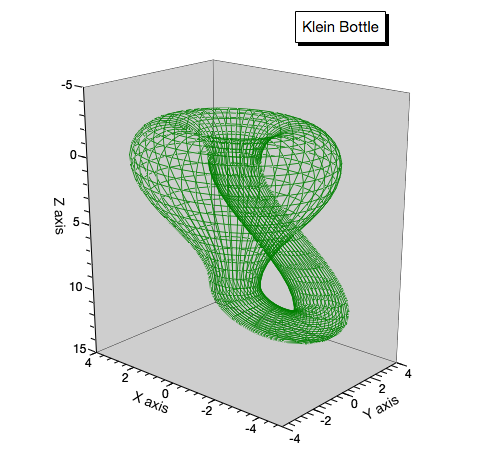
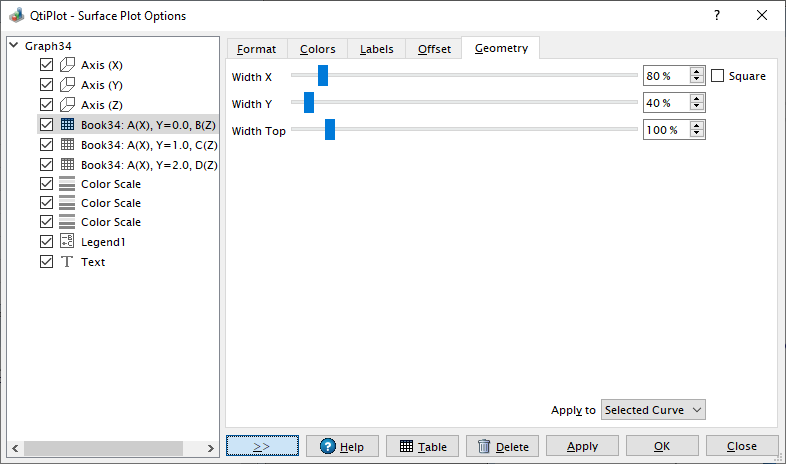
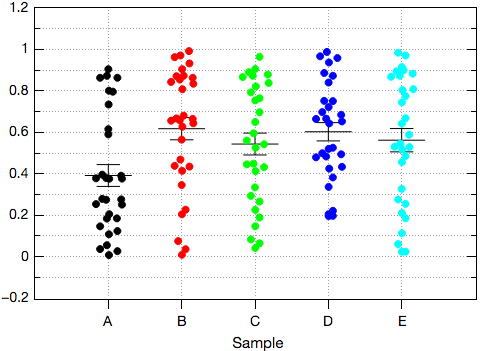
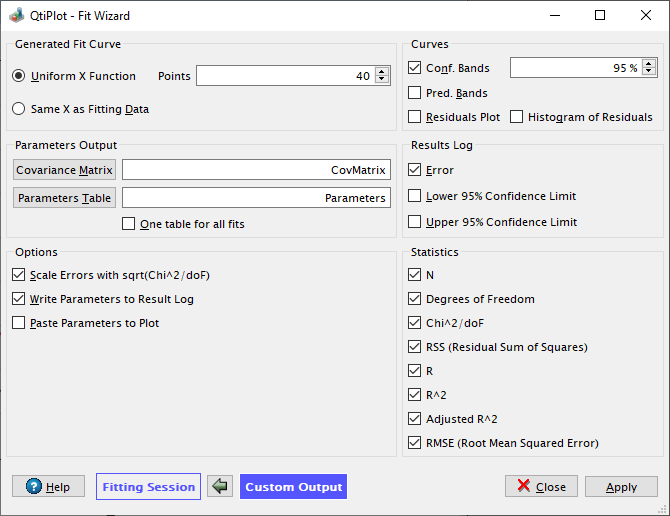
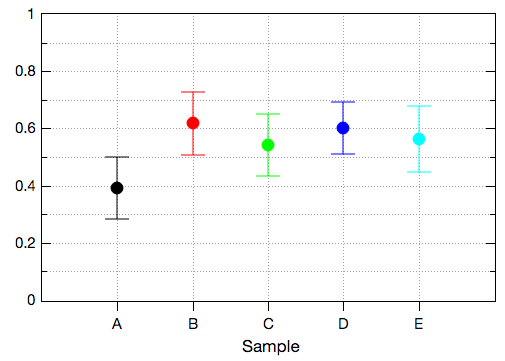
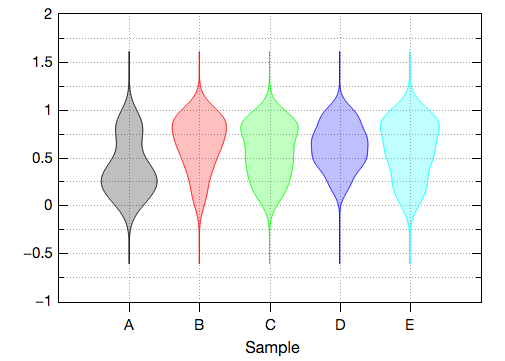
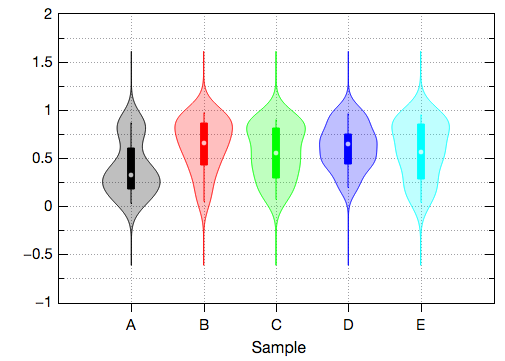
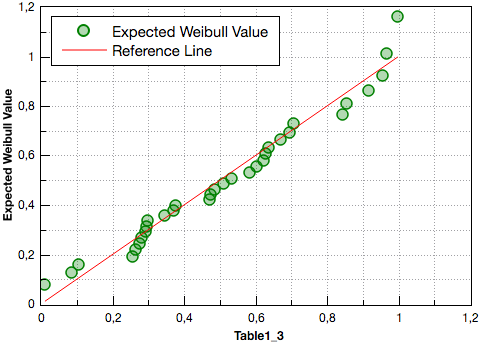
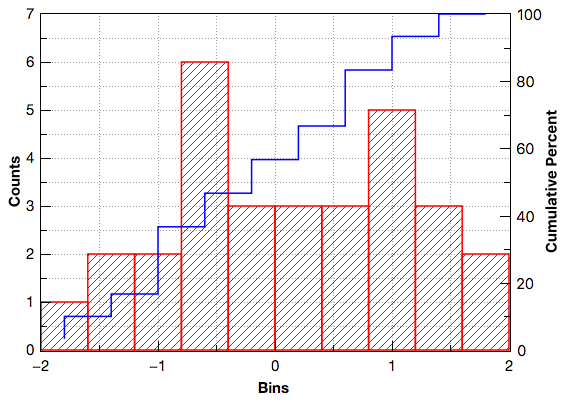
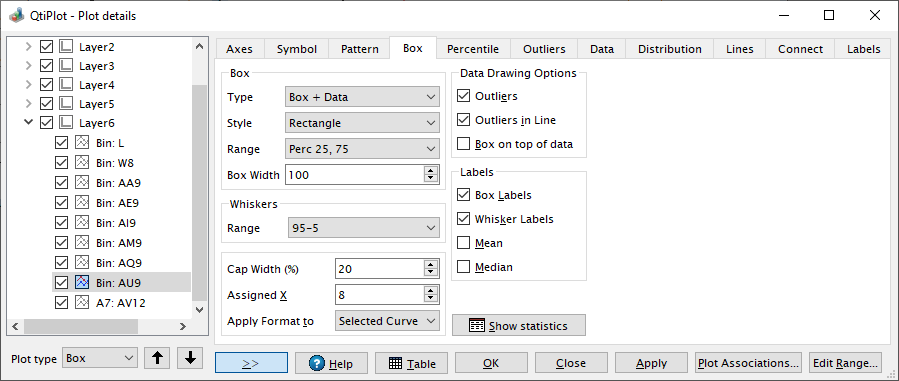
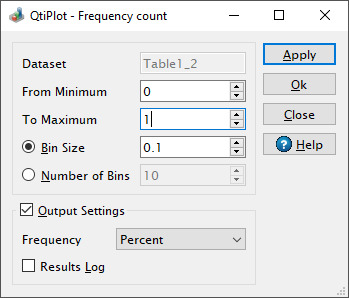
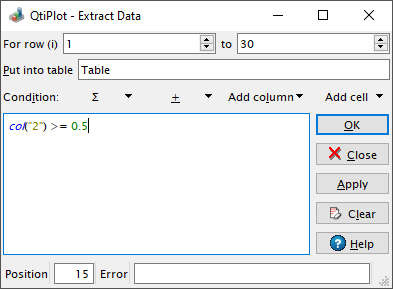
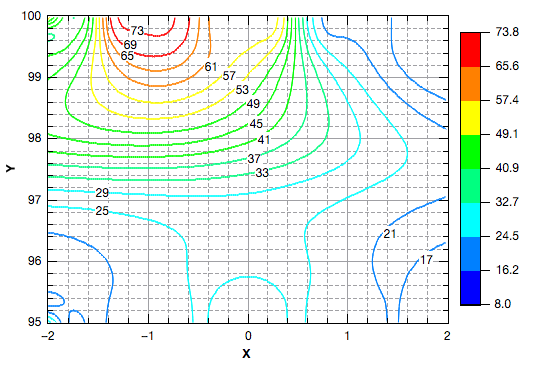
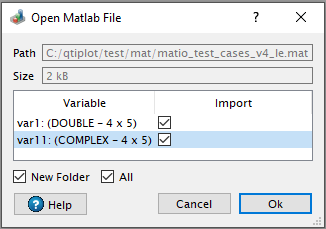
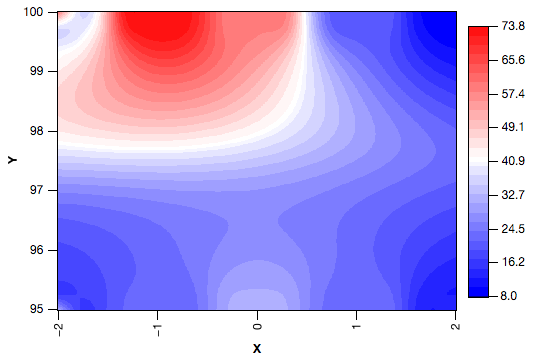
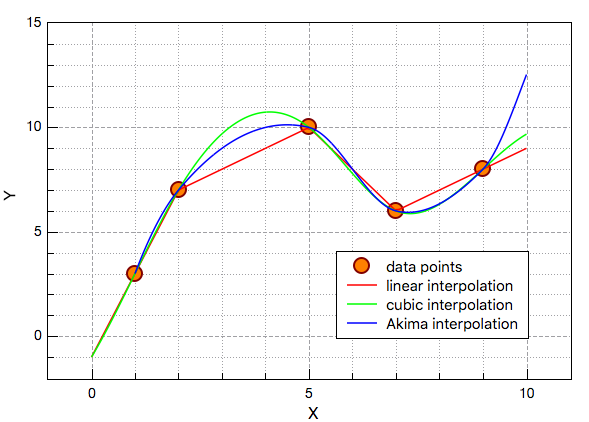
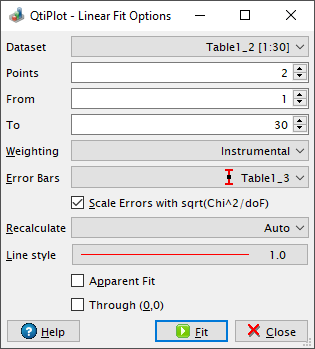
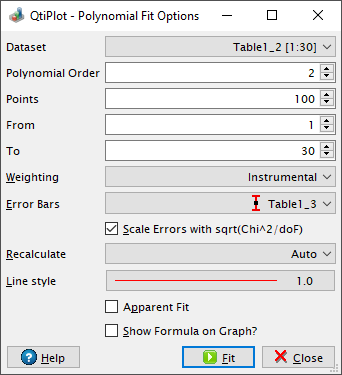
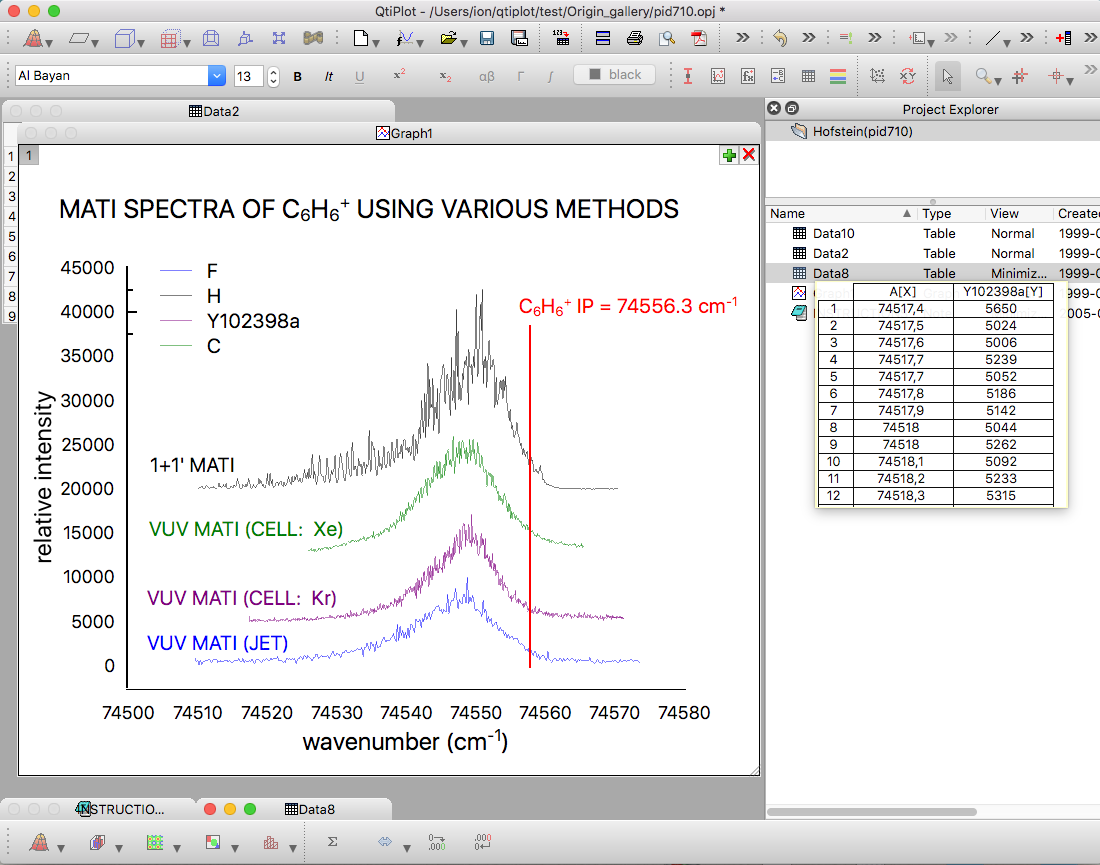
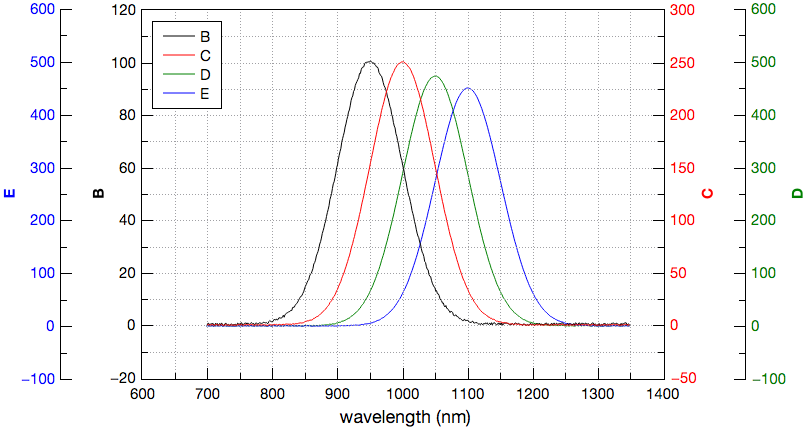
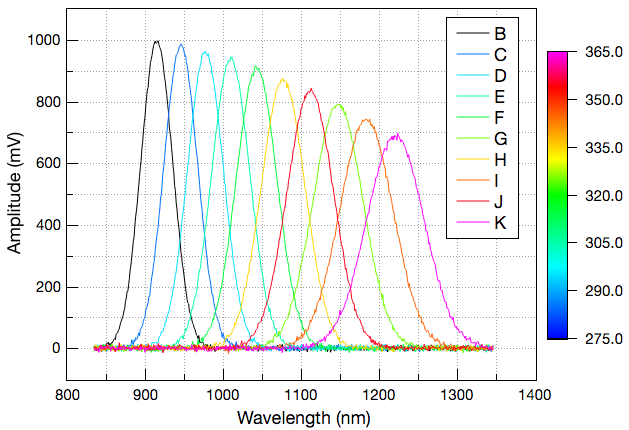
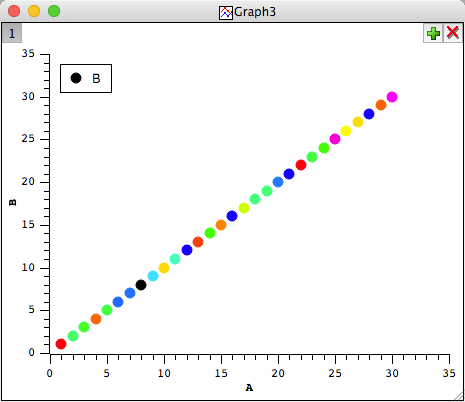
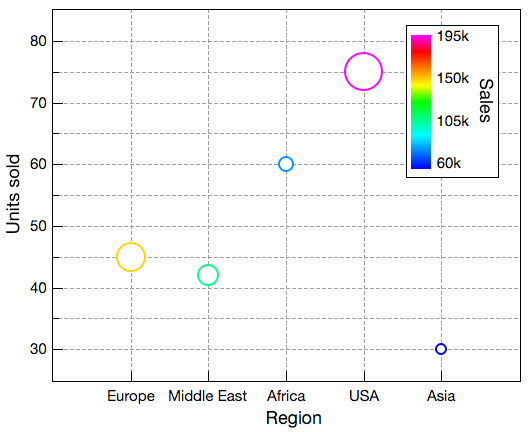
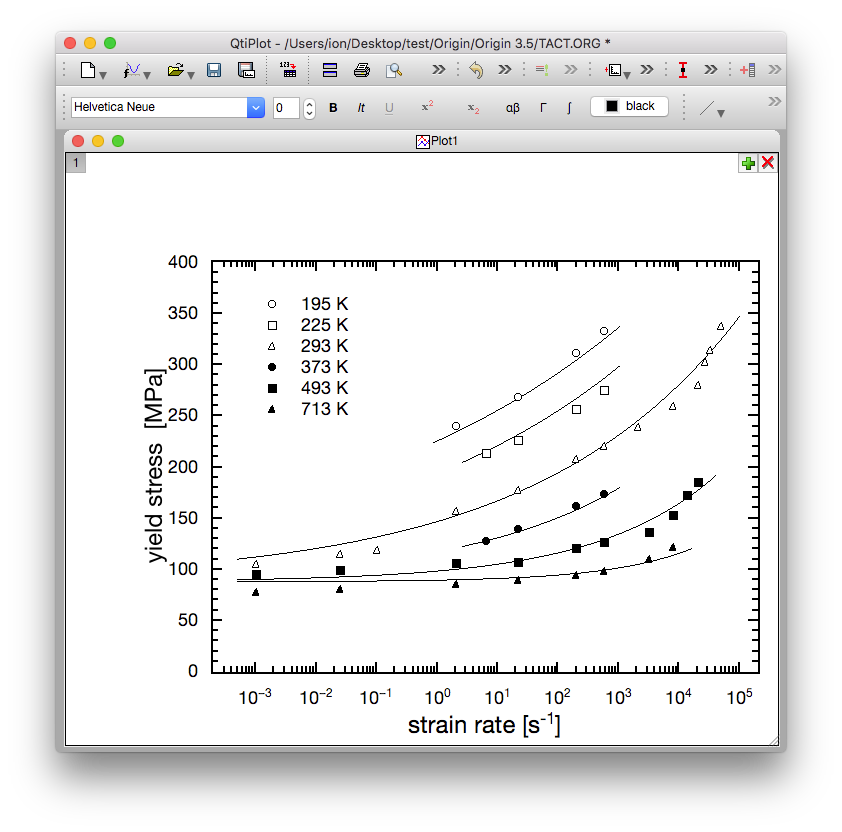
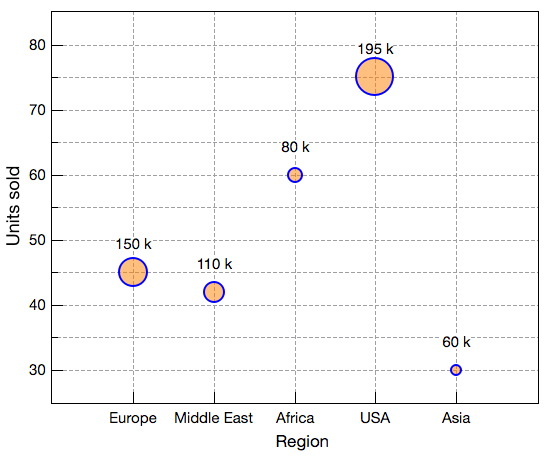