QtiPlot - Data Analysis and Scientific Visualisation |
Try for free |
| Home | Download | Contact |
Export graphics to TeXQtiPlot can be easily integrated with LaTeX, the high-quality typesetting system which is the de facto standard for the communication and publication of scientific documents: all worksheets can be exported as .tex tables and all plots can be exported as .tex figures using the TikZ/Pgf graphic systems. This makes straightforward the integration of text labels with complex mathematical expressions into QtiPlot graphs, like in the example bellow: 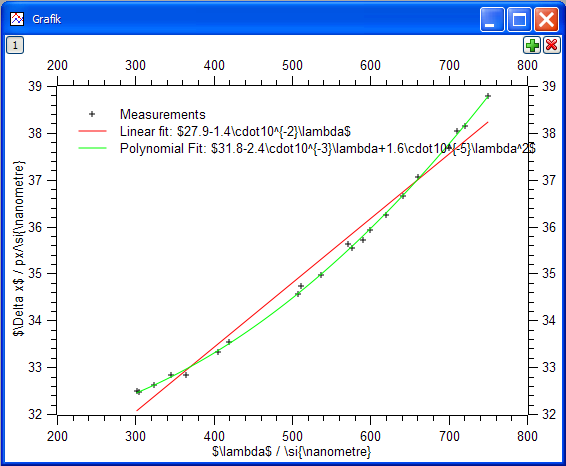
Example of editing a 2D plot using text labels with LaTeX math mode. ×
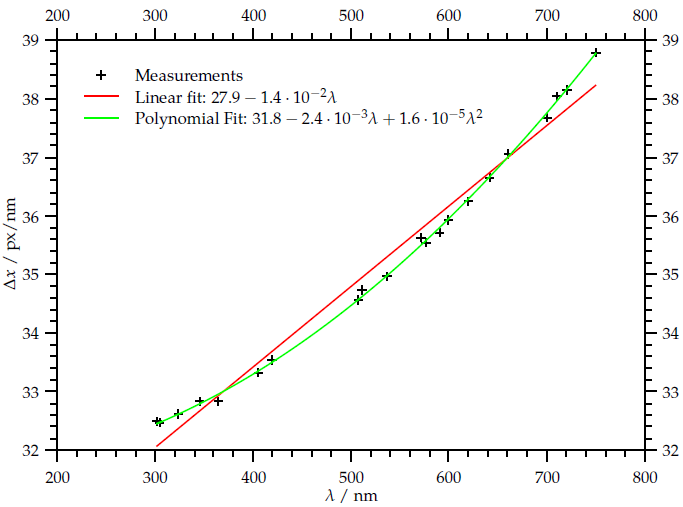
Resulting image after export to .tex and LaTeX compilation of the 2D plot from the previous example. ×
Equation editor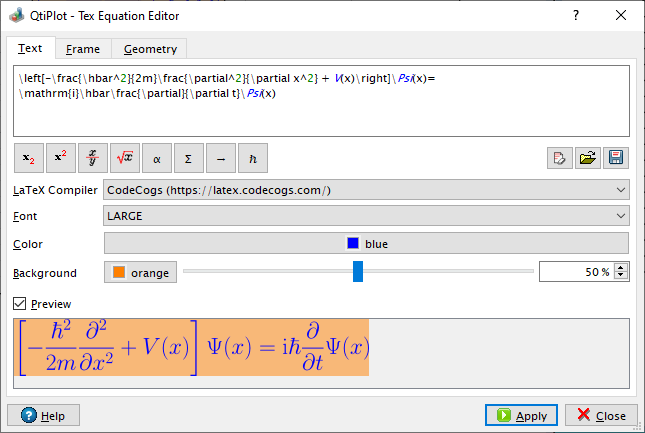
By default the equation editor renders equation markup via a built-in LaTeX parser. QtiPlot can also make use of a LaTeX compiler web service, all you need is an internet connection. ×
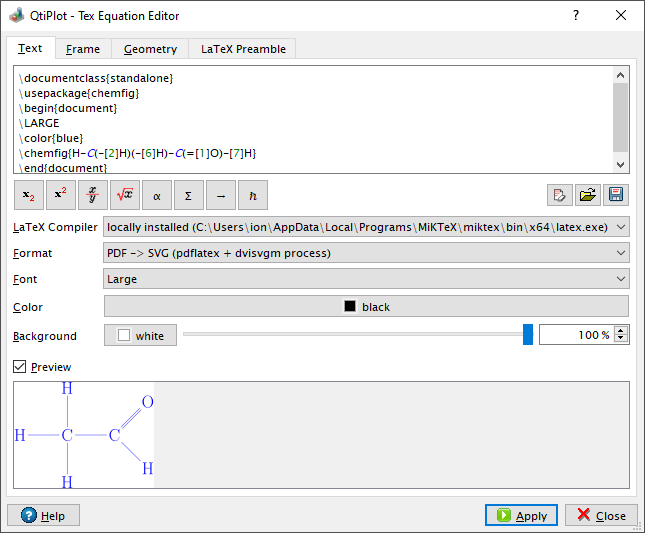
QtiPlot can be easily integrated with a locally installed LaTeX compiler making possible the compilation of complete documents and not just of equation markup, so that you can fully customize the image output in terms of font size, text and background color. ×
|